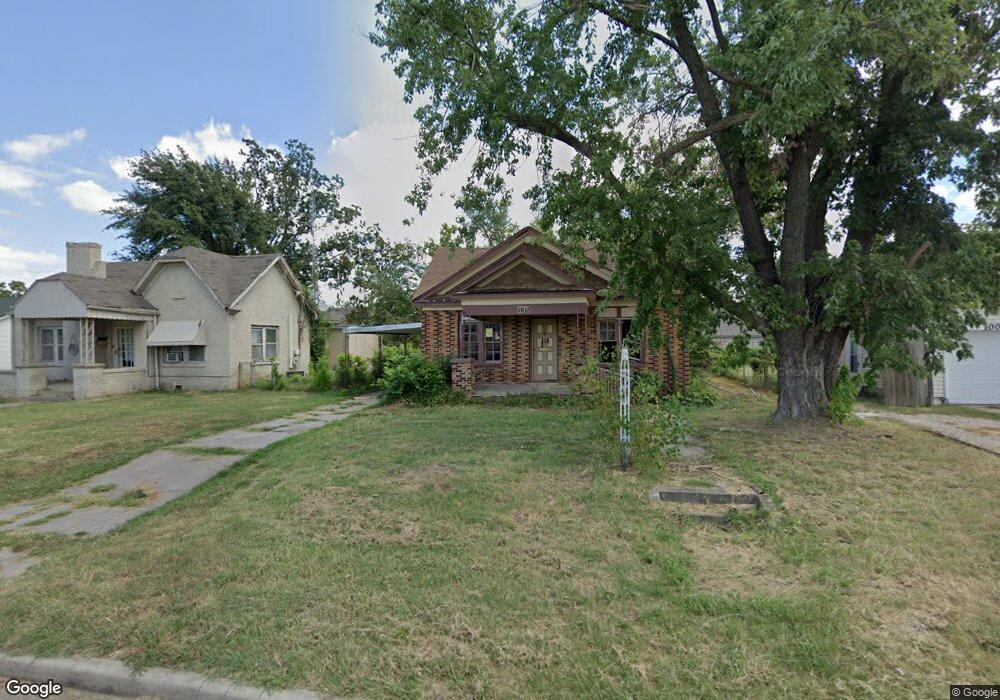
1011 Overland Ct Shawnee, OK 74801
Estimated Value: $60,605 - $113,000
3
Beds
1
Bath
823
Sq Ft
$96/Sq Ft
Est. Value
About This Home
This home is located at 1011 Overland Ct, Shawnee, OK 74801 and is currently estimated at $79,401, approximately $96 per square foot. 1011 Overland Ct is a home located in Pottawatomie County with nearby schools including Jefferson Elementary School, Shawnee Middle School, and Shawnee High School.
Ownership History
Date
Name
Owned For
Owner Type
Purchase Details
Closed on
Jul 14, 2023
Sold by
Marquez Sergio and Marquez Yessenia
Bought by
T & T Enterprises
Current Estimated Value
Purchase Details
Closed on
Jul 13, 2023
Sold by
Griffin Land Holdings Llc
Bought by
Marquez Sergio and Marquez Yessenia
Purchase Details
Closed on
Sep 18, 2020
Sold by
Rocky Griffin Of Griffin Landholdings Ll
Bought by
Marquez Yessenia and Marquez Sergio
Purchase Details
Closed on
May 18, 2020
Sold by
Bierd Tom and Bierd Properties Llc
Bought by
Griffin Landholdings Llc
Purchase Details
Closed on
Oct 21, 2019
Sold by
Quick Real Estate Solutions Llc
Bought by
Bierd Properties Llc
Purchase Details
Closed on
Aug 30, 2019
Sold by
Jvl Holding Llc
Bought by
Quick Real Estate Solutions Llc
Purchase Details
Closed on
Aug 28, 2008
Sold by
Coffee Virgil
Bought by
Jvl Holding Llc
Purchase Details
Closed on
Dec 3, 1998
Sold by
Coffee Virgil
Bought by
Jvl Holding Llc
Create a Home Valuation Report for This Property
The Home Valuation Report is an in-depth analysis detailing your home's value as well as a comparison with similar homes in the area
Home Values in the Area
Average Home Value in this Area
Purchase History
| Date | Buyer | Sale Price | Title Company |
|---|---|---|---|
| T & T Enterprises | $15,000 | Titan Title Insurance Agency I | |
| Marquez Sergio | -- | Titan Title Insurance Agency I | |
| Marquez Yessenia | $20,000 | None Available | |
| Griffin Landholdings Llc | $7,500 | None Available | |
| Bierd Properties Llc | $7,500 | None Available | |
| Quick Real Estate Solutions Llc | $1,000 | None Available | |
| Jvl Holding Llc | -- | None Available | |
| Jvl Holding Llc | $24,000 | -- |
Source: Public Records
Tax History Compared to Growth
Tax History
| Year | Tax Paid | Tax Assessment Tax Assessment Total Assessment is a certain percentage of the fair market value that is determined by local assessors to be the total taxable value of land and additions on the property. | Land | Improvement |
|---|---|---|---|---|
| 2024 | $251 | $3,437 | $720 | $2,717 |
| 2023 | $251 | $2,400 | $720 | $1,680 |
| 2022 | $246 | $2,400 | $720 | $1,680 |
| 2021 | $242 | $2,400 | $720 | $1,680 |
| 2020 | $459 | $4,542 | $720 | $3,822 |
| 2019 | $419 | $4,017 | $720 | $3,297 |
| 2018 | $391 | $3,825 | $720 | $3,105 |
| 2017 | $368 | $3,643 | $720 | $2,923 |
| 2016 | $354 | $3,469 | $720 | $2,749 |
| 2015 | $330 | $3,304 | $720 | $2,584 |
| 2014 | $315 | $3,147 | $720 | $2,427 |
Source: Public Records
Map
Nearby Homes
- 1012 N Chapman Ave
- 920 N Kickapoo Ave
- 810 N Kickapoo Ave
- 318 W Dill St
- 1006 N Market Ave
- 1324 N Park Ave
- 607 W Dewey St
- 1217 N Market Ave
- 718 N Park Ave
- 735 N Park Ave
- 1108 W Dewey St
- 824 N Beard Ave
- 611 N Chapman Ave
- 634 N Louisa Ave
- 1017 N Bdwy Ave
- 727 N Beard Ave
- 548 N Kickapoo Ave
- 548 N Ione Ave
- 1710 N Park Ave
- 615 N Park Ave
- 1011 N Overland Ct
- 1009 Overland Ct
- 1015 Overland Ct
- 1007 N Overland Ct
- 1007 Overland Ct
- 1019 Overland Ct
- 1010 N Chapman Ave
- 1016 N Chapman Ave
- 1005 Overland Ct
- 1012 Overland Ct
- 1014 Overland Ct
- 1010 Overland Ct
- 1008 Overland Ct
- 1008 N Chapman Ave
- 1003 Overland Ct
- 602 W Kirk St
- 1004 Overland Ct
- 1006 Overland Ct
- 1004 N Chapman Ave
- 612 W Kirk St