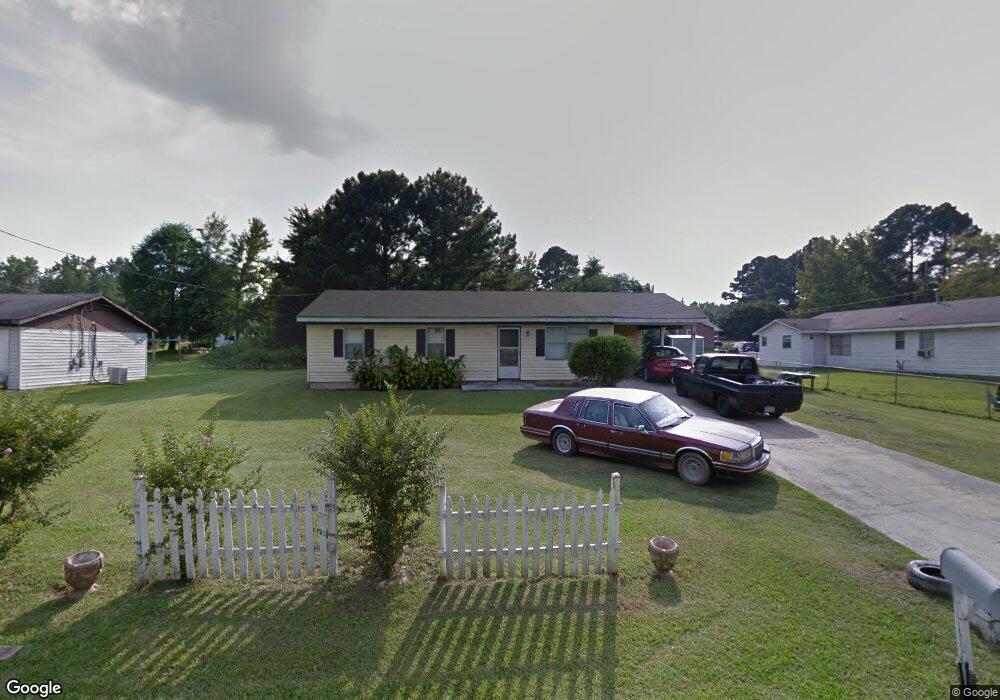
1011 Parham Dr Union Point, GA 30669
Estimated Value: $87,000 - $173,000
3
Beds
2
Baths
1,138
Sq Ft
$103/Sq Ft
Est. Value
About This Home
This home is located at 1011 Parham Dr, Union Point, GA 30669 and is currently estimated at $117,544, approximately $103 per square foot. 1011 Parham Dr is a home located in Greene County with nearby schools including Greene County High School.
Ownership History
Date
Name
Owned For
Owner Type
Purchase Details
Closed on
Nov 22, 1999
Sold by
Williams Phillip and Mary Curry
Bought by
Curry Mary and Ray Sellers----
Current Estimated Value
Purchase Details
Closed on
Mar 2, 1999
Sold by
Williams Phillip and Mary Curry
Bought by
Williams Phillip and Mary Curry
Purchase Details
Closed on
Mar 1, 1999
Sold by
Deer Run Properties Inc
Bought by
Williams Phillip and Mary Curry
Purchase Details
Closed on
Jan 1, 1986
Sold by
Bryans Norris and Conner Max
Bought by
Deer Run Properties Inc
Purchase Details
Closed on
Jan 1, 1985
Sold by
Fha
Bought by
Bryans Norris
Purchase Details
Closed on
Jan 1, 1984
Sold by
Thomas Beverlyn
Bought by
Fha
Purchase Details
Closed on
Jan 1, 1982
Sold by
Fha
Bought by
Thomas Beverlyn
Purchase Details
Closed on
Jan 1, 1980
Sold by
Van Lier General & Johnnie
Bought by
Fha
Purchase Details
Closed on
Jan 1, 1977
Sold by
Wilson William
Bought by
Van Lier General & Johnnie
Purchase Details
Closed on
Jan 1, 1974
Sold by
Wilson William R Etal
Bought by
Wilson William R Etal
Create a Home Valuation Report for This Property
The Home Valuation Report is an in-depth analysis detailing your home's value as well as a comparison with similar homes in the area
Purchase History
| Date | Buyer | Sale Price | Title Company |
|---|---|---|---|
| Curry Mary | -- | -- | |
| Williams Phillip | $15,000 | -- | |
| Williams Phillip | -- | -- | |
| Deer Run Properties Inc | -- | -- | |
| Bryans Norris | -- | -- | |
| Bryans Norris | -- | -- | |
| Fha | -- | -- | |
| Thomas Beverlyn | -- | -- | |
| Fha | -- | -- | |
| Van Lier General & Johnnie | -- | -- | |
| Wilson William | -- | -- | |
| Wilson William R Etal | -- | -- |
Source: Public Records
Tax History Compared to Growth
Tax History
| Year | Tax Paid | Tax Assessment Tax Assessment Total Assessment is a certain percentage of the fair market value that is determined by local assessors to be the total taxable value of land and additions on the property. | Land | Improvement |
|---|---|---|---|---|
| 2025 | $607 | $21,600 | $2,520 | $19,080 |
| 2024 | $591 | $19,880 | $2,520 | $17,360 |
| 2023 | $247 | $19,680 | $2,520 | $17,160 |
| 2022 | $413 | $17,840 | $2,520 | $15,320 |
| 2021 | $421 | $16,080 | $2,520 | $13,560 |
| 2020 | $392 | $13,240 | $2,680 | $10,560 |
| 2019 | $401 | $13,240 | $2,680 | $10,560 |
| 2018 | $262 | $13,240 | $2,680 | $10,560 |
| 2017 | $360 | $13,295 | $2,700 | $10,595 |
| 2016 | $369 | $13,530 | $2,700 | $10,830 |
| 2015 | $339 | $13,530 | $2,700 | $10,830 |
| 2014 | $345 | $13,554 | $2,700 | $10,854 |
Source: Public Records
Map
Nearby Homes
- 0 S Rhodes St Unit 10618488
- 0 Washington Hwy Unit 7276060
- 215 Hunter St
- 324 N Rhodes St
- 202 Veazey St
- 1241 Old Siloam Rd
- 0 Woodland Ct Unit 10543600
- 112 Hendry St
- 1581 Highway 77 S Hwy
- 1581 Highway 77 S
- 1251 Adams Rd
- 1860 Washington Hwy
- 0 Old Union Point Rd Unit 1 10557753
- 5401 Union Point Hwy
- 1251 Brick House Rd
- 1251 Brickhouse Rd
- 1201 Buffalo Lick Rd
- 0 Buffalo Lick Rd Unit 10551234
- 0 Buffalo Lick Rd Unit 10551325
- 1470 Bramlett Rd
- 1021 Parham Dr
- 1070 Bloodworth St
- 1010 Alexander St
- 1010 Alexander Ave
- 1020 Alexander St
- 1010 Parham Dr
- 1080 Bloodworth St
- 1031 Parham Dr
- 1020 Parham Dr
- 1050 Bloodworth St
- 1030 Alexander St
- 1030 Parham Dr
- 36 Alexander Ave
- 36 Alexander Ave
- 1081 Bloodworth St
- 1170 Alexander St
- 1041 Parham Dr
- 1160 Alexander St
- 1040 Bloodworth St
- 1011 Alexander St