1011 Plantation Point Dr Unit LOT 29 Greensboro, GA 30642
Estimated Value: $1,153,611 - $1,795,000
3
Beds
3
Baths
2,275
Sq Ft
$597/Sq Ft
Est. Value
About This Home
This home is located at 1011 Plantation Point Dr Unit LOT 29, Greensboro, GA 30642 and is currently estimated at $1,357,903, approximately $596 per square foot. 1011 Plantation Point Dr Unit LOT 29 is a home located in Greene County with nearby schools including Greene County High School.
Ownership History
Date
Name
Owned For
Owner Type
Purchase Details
Closed on
May 7, 2014
Sold by
Benshoof Dan
Bought by
Benshoof Dan H Hele
Current Estimated Value
Purchase Details
Closed on
Feb 27, 2012
Sold by
Cartee Jamey
Bought by
Benshoof Dan
Purchase Details
Closed on
Oct 28, 2005
Sold by
Smith Robert D and Smith Betty J
Bought by
Cartee Jamey
Home Financials for this Owner
Home Financials are based on the most recent Mortgage that was taken out on this home.
Original Mortgage
$226,260
Interest Rate
5.84%
Mortgage Type
New Conventional
Purchase Details
Closed on
Aug 28, 2001
Sold by
Woodlake Construction Llc
Bought by
Smith Robert D and Smith Betty J
Purchase Details
Closed on
Apr 24, 2001
Sold by
Murphy Valynda S
Bought by
Woodlake Construction Llc
Purchase Details
Closed on
Nov 1, 2000
Sold by
Latimer Roy Thomas
Bought by
Murphy Valynda S
Purchase Details
Closed on
Dec 10, 1993
Bought by
Latimer Roy Thomas
Create a Home Valuation Report for This Property
The Home Valuation Report is an in-depth analysis detailing your home's value as well as a comparison with similar homes in the area
Home Values in the Area
Average Home Value in this Area
Purchase History
| Date | Buyer | Sale Price | Title Company |
|---|---|---|---|
| Benshoof Dan H Hele | -- | -- | |
| Benshoof Dan | $115,000 | -- | |
| Cartee Jamey | $211,000 | -- | |
| Smith Robert D | $195,000 | -- | |
| Woodlake Construction Llc | $110,000 | -- | |
| Murphy Valynda S | $110,000 | -- | |
| Latimer Roy Thomas | $47,300 | -- |
Source: Public Records
Mortgage History
| Date | Status | Borrower | Loan Amount |
|---|---|---|---|
| Previous Owner | Cartee Jamey | $226,260 |
Source: Public Records
Tax History Compared to Growth
Tax History
| Year | Tax Paid | Tax Assessment Tax Assessment Total Assessment is a certain percentage of the fair market value that is determined by local assessors to be the total taxable value of land and additions on the property. | Land | Improvement |
|---|---|---|---|---|
| 2024 | $2,118 | $332,200 | $74,000 | $258,200 |
| 2023 | $1,838 | $304,080 | $60,000 | $244,080 |
| 2022 | $2,368 | $214,520 | $56,000 | $158,520 |
| 2021 | $2,506 | $197,960 | $56,000 | $141,960 |
| 2020 | $2,748 | $153,280 | $43,200 | $110,080 |
| 2019 | $2,786 | $153,280 | $43,200 | $110,080 |
| 2018 | $2,763 | $153,280 | $43,200 | $110,080 |
| 2017 | $2,605 | $150,580 | $43,200 | $107,380 |
| 2016 | $2,606 | $150,580 | $43,200 | $107,380 |
| 2015 | $2,550 | $150,580 | $43,200 | $107,380 |
| 2014 | $2,608 | $149,910 | $57,600 | $92,310 |
Source: Public Records
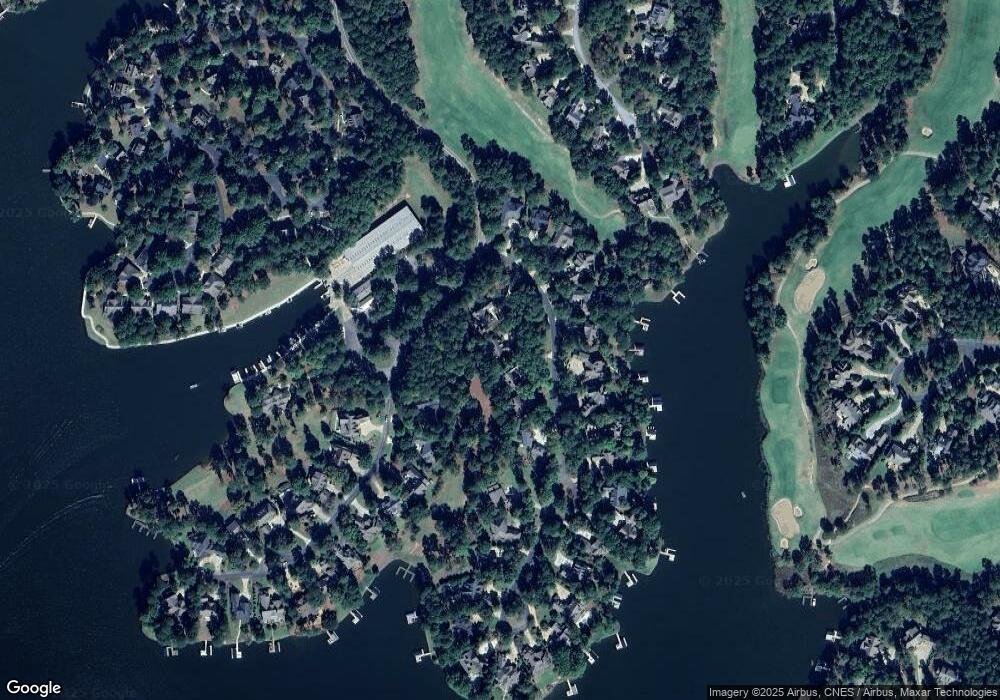
Map
Nearby Homes
- 1120 Plantation Point Dr
- 1010 Kimbrough Hill Dr
- 1201 Marina Cove Ln
- 1011 Kimbrough Hill Dr
- 1021 Branson Bluff
- 1031 Crackers Neck Rd
- 1010 Wrayswood Cir
- 1060 Liberty Bluff Ct
- 1001 Walton Way
- 1170 Liberty Bluff Rd
- 1030 Scott Loop
- 1441 Bennett Springs Dr
- 1131 Scull Shoals Dr
- 1121 Crackers Neck Rd
- 1051 Liberty Bluff Ln
- 1091 Jones Bluff Ct
- 1201 Linger Longer Dr
- 1341 Planters Trail
- 1101 Timothy Rd
- 1021 Plantation Point Dr
- 0 Plantation Point Unit 7476423
- 0 Plantation Point Unit 7602790
- 0 Plantation Point
- 1001 Plantation Point Dr
- 1001 Plantation Point Dr Unit 30
- 1031 Plantation Point Dr
- 1050 Plantation Point Dr
- 1060 Plantation Point Dr
- 1040 Plantation Point Dr
- 1030 Plantation Point Dr
- 3330 Linger Longer Rd
- 1070 Plantation Point Dr
- 0 Plantation Point Dr Unit 7078592
- 0 Plantation Point Dr Unit 3206060
- 0 Plantation Point Dr Unit 8339167
- 0 Plantation Point Dr Unit 8260820
- 0 Plantation Point Dr Unit 8540862
- 0 Plantation Point Dr Unit 8366966
- 0 Plantation Point Dr Unit 8570295