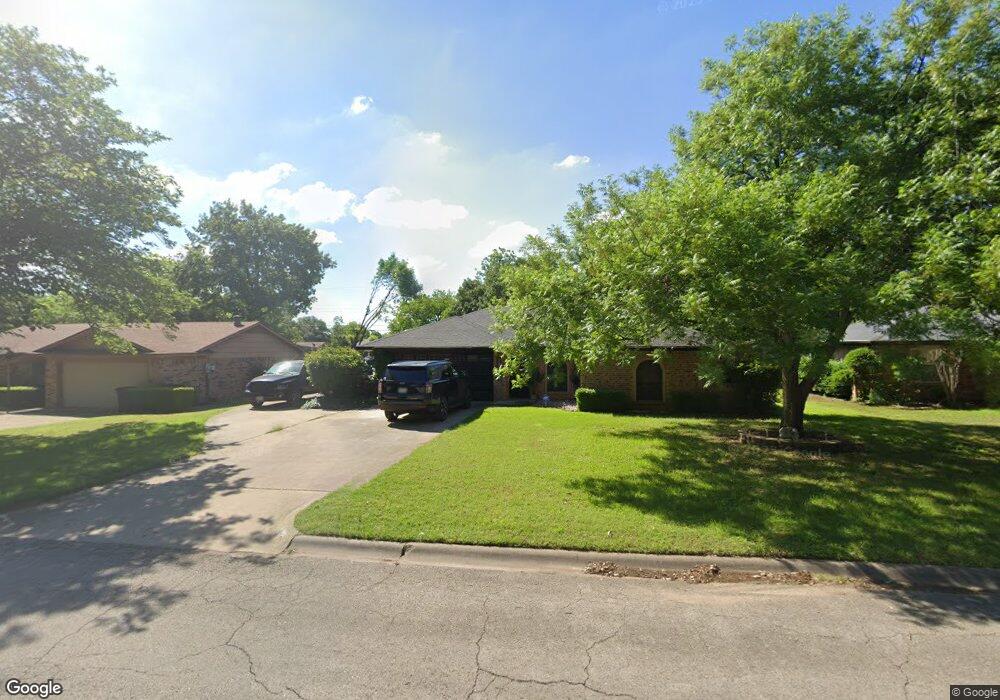
1011 Princeton Place Cleburne, TX 76033
Estimated Value: $239,272 - $251,000
3
Beds
2
Baths
1,518
Sq Ft
$162/Sq Ft
Est. Value
About This Home
This home is located at 1011 Princeton Place, Cleburne, TX 76033 and is currently estimated at $246,568, approximately $162 per square foot. 1011 Princeton Place is a home located in Johnson County with nearby schools including Coleman Elementary School, A.D. Wheat Middle School, and Cleburne High School.
Ownership History
Date
Name
Owned For
Owner Type
Purchase Details
Closed on
Feb 15, 2018
Sold by
Pollin Matthewn D and Pullin Heather
Bought by
Cook Kyler
Current Estimated Value
Home Financials for this Owner
Home Financials are based on the most recent Mortgage that was taken out on this home.
Original Mortgage
$131,572
Outstanding Balance
$115,356
Interest Rate
5.5%
Mortgage Type
FHA
Estimated Equity
$131,212
Purchase Details
Closed on
Jan 16, 2017
Sold by
Wasilchak Frances and Estate John Wasilchak
Bought by
Babbitt Homes Llc
Purchase Details
Closed on
Jul 15, 2015
Sold by
Kelley Homer G and Kelley Franikie M
Bought by
Pullin Matthew D
Home Financials for this Owner
Home Financials are based on the most recent Mortgage that was taken out on this home.
Original Mortgage
$93,279
Interest Rate
4.75%
Mortgage Type
FHA
Create a Home Valuation Report for This Property
The Home Valuation Report is an in-depth analysis detailing your home's value as well as a comparison with similar homes in the area
Home Values in the Area
Average Home Value in this Area
Purchase History
| Date | Buyer | Sale Price | Title Company |
|---|---|---|---|
| Cook Kyler | -- | None Available | |
| Babbitt Homes Llc | -- | Stewart | |
| Pullin Matthew D | -- | Stnt |
Source: Public Records
Mortgage History
| Date | Status | Borrower | Loan Amount |
|---|---|---|---|
| Open | Cook Kyler | $131,572 | |
| Previous Owner | Pullin Matthew D | $93,279 |
Source: Public Records
Tax History Compared to Growth
Tax History
| Year | Tax Paid | Tax Assessment Tax Assessment Total Assessment is a certain percentage of the fair market value that is determined by local assessors to be the total taxable value of land and additions on the property. | Land | Improvement |
|---|---|---|---|---|
| 2025 | $3,036 | $231,587 | $47,500 | $184,087 |
| 2024 | $4,405 | $197,578 | $0 | $0 |
| 2023 | $2,656 | $231,587 | $47,500 | $184,087 |
| 2022 | $4,086 | $200,029 | $47,500 | $152,529 |
| 2021 | $3,873 | $148,443 | $29,500 | $118,943 |
| 2020 | $3,850 | $138,943 | $20,000 | $118,943 |
| 2019 | $4,106 | $138,943 | $20,000 | $118,943 |
| 2018 | $3,662 | $123,877 | $26,500 | $97,377 |
| 2017 | $3,460 | $117,541 | $21,725 | $95,816 |
| 2016 | $2,760 | $93,742 | $21,725 | $72,017 |
| 2015 | $693 | $93,742 | $21,725 | $72,017 |
| 2014 | $693 | $84,816 | $21,725 | $63,091 |
Source: Public Records
Map
Nearby Homes
- 1016 Sheridan Ln
- 1006 Princeton Place
- 106 Glen Rose Ave
- 311 N Pendell Ave
- 618 Woodard Ave
- 1102 Lena St
- 604 Mcanear St
- 104 Dixon St
- 1307 Joslin St
- 1300 Belvon Place
- 107 Woodard Ave
- 1123 Bales St
- 618 Granbury St
- 1419 Quail Creek Dr
- Iverson 1 Plan at Trail Creek
- Hanover Plan at Trail Creek
- Devin Plan at Trail Creek
- Newcastle Plan at Trail Creek
- Sherwood Plan at Trail Creek
- Essex Plan at Trail Creek
- 1013 Princeton Place
- 1009 Princeton Place
- 1012 Sheridan Ln
- 1017 Princeton Place
- 1010 Sheridan Ln
- 1007 Princeton Place
- 1014 Sheridan Ln
- 1012 Princeton Place
- 1014 Princeton Place
- 1008 Sheridan Ln
- 1016 Princeton Place
- 1019 Princeton Place
- 1005 Princeton Place
- 1018 Princeton Place
- 1006 Sheridan Ln
- 1021 Princeton Place
- 1011 Sheridan Ln
- 1009 Sheridan Ln
- 1003 Princeton Place
- 1013 Sheridan Ln