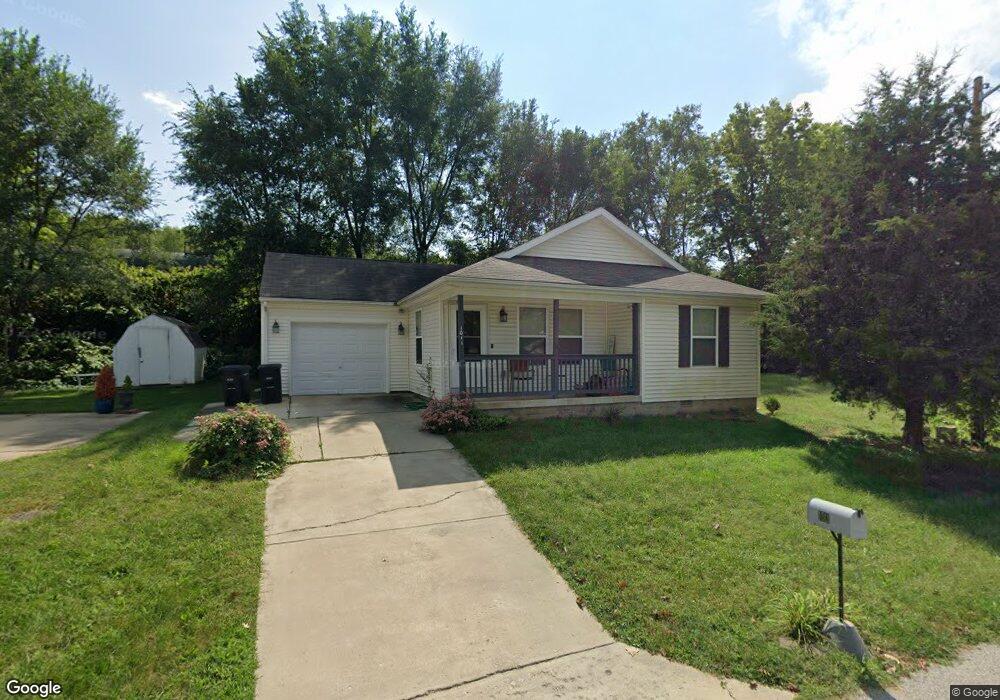
1011 Queen St Lafayette, IN 47905
Wabash NeighborhoodEstimated Value: $143,000 - $168,000
2
Beds
1
Bath
872
Sq Ft
$177/Sq Ft
Est. Value
About This Home
This home is located at 1011 Queen St, Lafayette, IN 47905 and is currently estimated at $154,151, approximately $176 per square foot. 1011 Queen St is a home located in Tippecanoe County with nearby schools including Thomas Miller Elementary School, Sunnyside Intermediate School, and Lafayette Tecumseh Junior High School.
Ownership History
Date
Name
Owned For
Owner Type
Purchase Details
Closed on
Oct 28, 2011
Sold by
Habitat For Humanity Of Lafayette Inc
Bought by
Young Monique D
Current Estimated Value
Home Financials for this Owner
Home Financials are based on the most recent Mortgage that was taken out on this home.
Original Mortgage
$37,762
Outstanding Balance
$15,062
Interest Rate
4.09%
Mortgage Type
Seller Take Back
Estimated Equity
$139,089
Purchase Details
Closed on
Jan 20, 2011
Sold by
Parkinson Yvonne and Van Der Aa Yvonne
Bought by
Habitat For Humanity Of Lafayette Inc
Purchase Details
Closed on
Oct 28, 2005
Sold by
Habitat For Humanity Of Lafayette Inc
Bought by
Aa Yvonne Van Der
Purchase Details
Closed on
Jun 10, 2002
Sold by
Habitat For Humanity Of Lafayette Inc
Bought by
City Of Lafayette
Create a Home Valuation Report for This Property
The Home Valuation Report is an in-depth analysis detailing your home's value as well as a comparison with similar homes in the area
Home Values in the Area
Average Home Value in this Area
Purchase History
| Date | Buyer | Sale Price | Title Company |
|---|---|---|---|
| Young Monique D | -- | None Available | |
| Habitat For Humanity Of Lafayette Inc | -- | None Available | |
| Aa Yvonne Van Der | -- | -- | |
| City Of Lafayette | -- | -- |
Source: Public Records
Mortgage History
| Date | Status | Borrower | Loan Amount |
|---|---|---|---|
| Open | Young Monique D | $37,762 |
Source: Public Records
Tax History Compared to Growth
Tax History
| Year | Tax Paid | Tax Assessment Tax Assessment Total Assessment is a certain percentage of the fair market value that is determined by local assessors to be the total taxable value of land and additions on the property. | Land | Improvement |
|---|---|---|---|---|
| 2024 | $722 | $104,000 | $16,300 | $87,700 |
| 2023 | $693 | $101,400 | $16,300 | $85,100 |
| 2022 | $586 | $88,000 | $16,300 | $71,700 |
| 2021 | $511 | $82,000 | $16,300 | $65,700 |
| 2020 | $406 | $76,000 | $16,300 | $59,700 |
| 2019 | $467 | $80,300 | $19,500 | $60,800 |
| 2018 | $451 | $79,000 | $19,500 | $59,500 |
| 2017 | $446 | $79,100 | $19,500 | $59,600 |
| 2016 | $431 | $78,700 | $19,500 | $59,200 |
| 2014 | $504 | $84,400 | $19,500 | $64,900 |
| 2013 | $504 | $84,900 | $19,500 | $65,400 |
Source: Public Records
Map
Nearby Homes