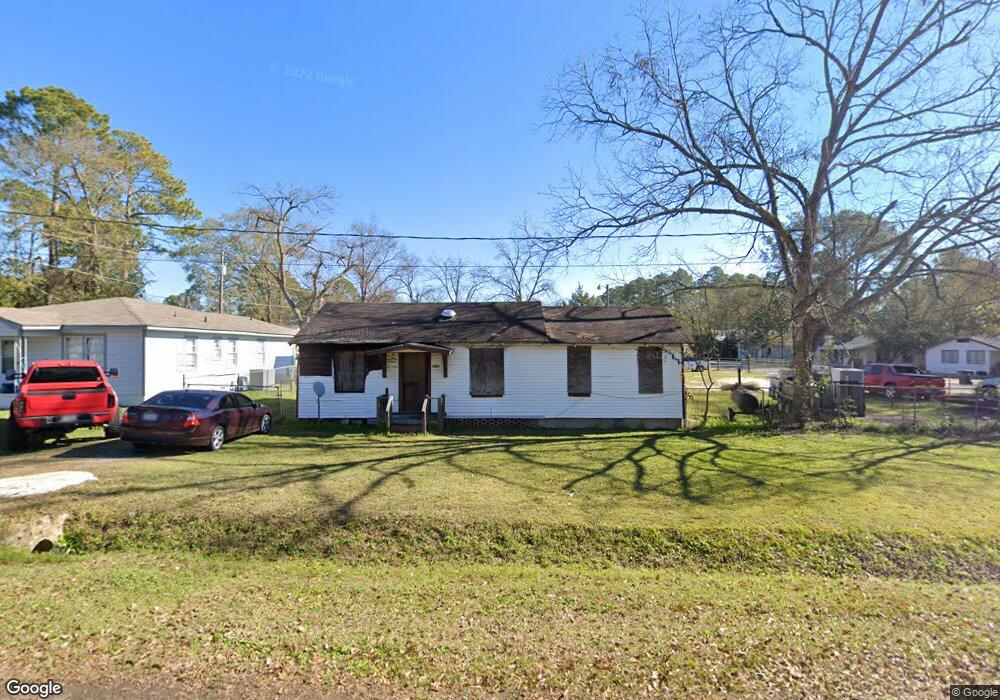
1011 S 4th St Cordele, GA 31015
Estimated Value: $72,307 - $117,000
--
Bed
1
Bath
1,002
Sq Ft
$91/Sq Ft
Est. Value
About This Home
This home is located at 1011 S 4th St, Cordele, GA 31015 and is currently estimated at $90,769, approximately $90 per square foot. 1011 S 4th St is a home located in Crisp County with nearby schools including Crisp County Elementary School, Crisp County Primary School, and Crisp County Middle School.
Ownership History
Date
Name
Owned For
Owner Type
Purchase Details
Closed on
Jan 25, 2013
Sold by
Calhoun George Kenneth
Bought by
Alfaro Mario Galvez and Hidalgo Rosaura Ortiz
Current Estimated Value
Purchase Details
Closed on
May 10, 2000
Sold by
Head Harley D
Bought by
Calhoun George K
Purchase Details
Closed on
Mar 9, 2000
Sold by
Head Harley D
Bought by
Head Harley D
Purchase Details
Closed on
May 16, 1997
Sold by
Satterfield Melba
Bought by
Head Harley D
Purchase Details
Closed on
Jul 31, 1996
Sold by
Satterfield Johnny+
Bought by
Satterfield Melba
Purchase Details
Closed on
Mar 3, 1990
Sold by
Mcbryant James V +
Bought by
Satterfield Johnny+
Create a Home Valuation Report for This Property
The Home Valuation Report is an in-depth analysis detailing your home's value as well as a comparison with similar homes in the area
Home Values in the Area
Average Home Value in this Area
Purchase History
| Date | Buyer | Sale Price | Title Company |
|---|---|---|---|
| Alfaro Mario Galvez | $8,000 | -- | |
| Calhoun George K | $22,000 | -- | |
| Head Harley D | -- | -- | |
| Head Harley D | $25,000 | -- | |
| Satterfield Melba | -- | -- | |
| Satterfield Johnny+ | $19,500 | -- |
Source: Public Records
Tax History Compared to Growth
Tax History
| Year | Tax Paid | Tax Assessment Tax Assessment Total Assessment is a certain percentage of the fair market value that is determined by local assessors to be the total taxable value of land and additions on the property. | Land | Improvement |
|---|---|---|---|---|
| 2024 | $64 | $1,777 | $1,667 | $110 |
| 2023 | $67 | $1,777 | $1,667 | $110 |
| 2022 | $47 | $1,777 | $1,667 | $110 |
| 2021 | $46 | $1,777 | $1,667 | $110 |
| 2020 | $50 | $1,777 | $1,667 | $110 |
| 2019 | $50 | $1,777 | $1,667 | $110 |
| 2018 | $85 | $2,896 | $2,666 | $230 |
| 2017 | $118 | $2,896 | $2,666 | $230 |
| 2016 | $86 | $2,896 | $2,666 | $230 |
| 2015 | -- | $2,897 | $2,666 | $230 |
| 2014 | -- | $8,184 | $2,666 | $5,517 |
| 2013 | -- | $2,666 | $2,666 | $0 |
Source: Public Records
Map
Nearby Homes