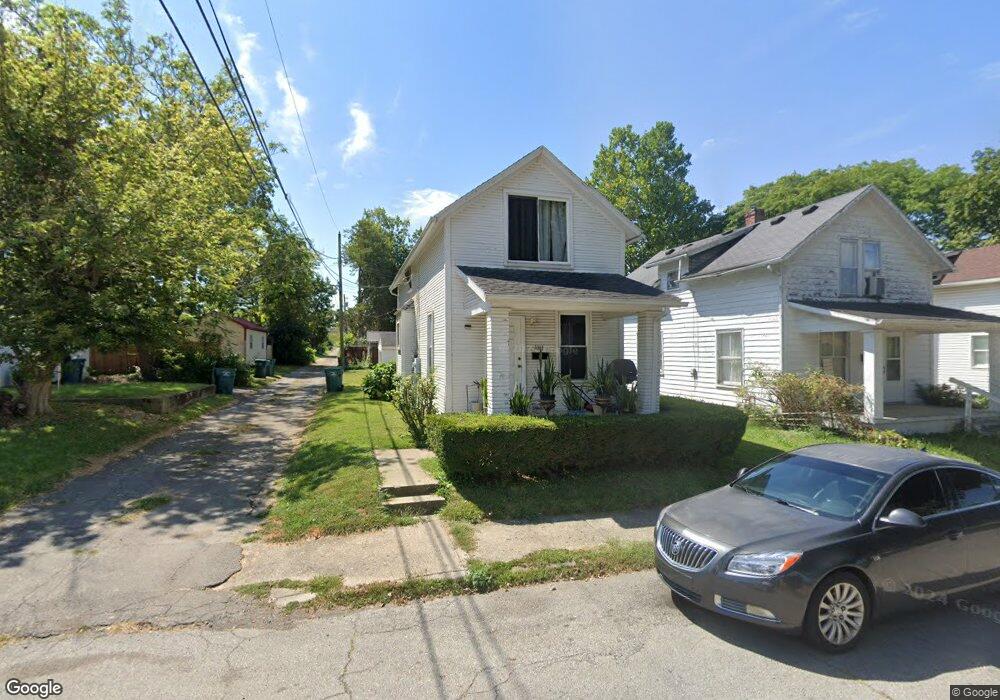
1011 S I St Richmond, IN 47374
Estimated Value: $61,510 - $82,000
2
Beds
1
Bath
1,070
Sq Ft
$66/Sq Ft
Est. Value
About This Home
This home is located at 1011 S I St, Richmond, IN 47374 and is currently estimated at $70,128, approximately $65 per square foot. 1011 S I St is a home located in Wayne County with nearby schools including Vaile Elementary School, Julia E. Test Intermediate School, and Richmond High School.
Ownership History
Date
Name
Owned For
Owner Type
Purchase Details
Closed on
Sep 8, 2023
Sold by
Shapiro Katherine
Bought by
Katherine Shapiro 2022 Family Trust and Shapiro
Current Estimated Value
Purchase Details
Closed on
Apr 5, 2017
Sold by
Smith Ronald L and Smith Carolyn S
Bought by
Shapiro Katherine
Purchase Details
Closed on
Oct 10, 2005
Sold by
Beneficial Indiana Inc
Bought by
Smith Ronald L and Smith Carolyn S
Purchase Details
Closed on
Jun 8, 2005
Sold by
Cooper Karen R
Bought by
Beneficial Indian Inc and Beneficial Mortgage Co
Create a Home Valuation Report for This Property
The Home Valuation Report is an in-depth analysis detailing your home's value as well as a comparison with similar homes in the area
Home Values in the Area
Average Home Value in this Area
Purchase History
| Date | Buyer | Sale Price | Title Company |
|---|---|---|---|
| Katherine Shapiro 2022 Family Trust | -- | None Listed On Document | |
| Shapiro Katherine | $3,000 | Abstracts Of Richmond | |
| Smith Ronald L | -- | -- | |
| Beneficial Indian Inc | $19,740 | -- |
Source: Public Records
Tax History Compared to Growth
Tax History
| Year | Tax Paid | Tax Assessment Tax Assessment Total Assessment is a certain percentage of the fair market value that is determined by local assessors to be the total taxable value of land and additions on the property. | Land | Improvement |
|---|---|---|---|---|
| 2024 | $842 | $42,100 | $3,400 | $38,700 |
| 2023 | $738 | $36,900 | $2,900 | $34,000 |
| 2022 | $722 | $36,100 | $2,900 | $33,200 |
| 2021 | $662 | $33,100 | $2,900 | $30,200 |
| 2020 | $662 | $33,100 | $2,900 | $30,200 |
| 2019 | $683 | $33,700 | $2,900 | $30,800 |
| 2018 | $683 | $33,700 | $2,900 | $30,800 |
| 2017 | $653 | $32,200 | $2,900 | $29,300 |
| 2016 | $653 | $32,200 | $2,900 | $29,300 |
| 2014 | $654 | $32,700 | $2,900 | $29,800 |
| 2013 | $654 | $34,100 | $2,900 | $31,200 |
Source: Public Records
Map
Nearby Homes