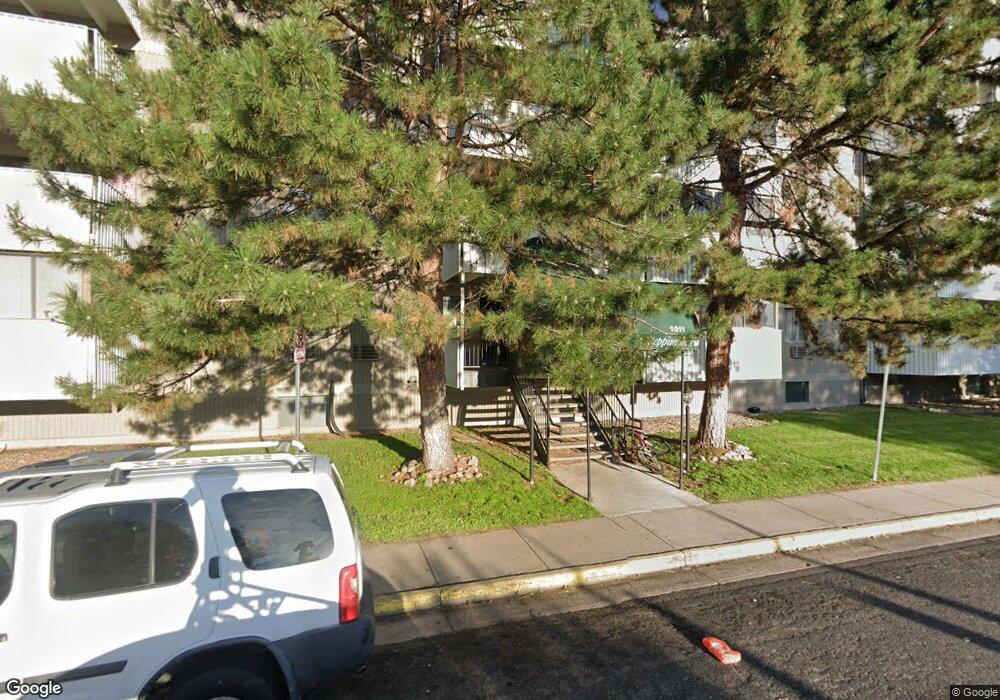
1011 S Ironton St Unit 508 Aurora, CO 80012
Expo Park NeighborhoodEstimated Value: $189,000 - $212,000
2
Beds
2
Baths
952
Sq Ft
$214/Sq Ft
Est. Value
About This Home
This home is located at 1011 S Ironton St Unit 508, Aurora, CO 80012 and is currently estimated at $204,057, approximately $214 per square foot. 1011 S Ironton St Unit 508 is a home located in Arapahoe County with nearby schools including Highline Community Elementary School, Prairie Middle School, and Overland High School.
Ownership History
Date
Name
Owned For
Owner Type
Purchase Details
Closed on
Oct 5, 2016
Sold by
Svetlana Imanova and Levin Zhanna
Bought by
Yaw Mark A
Current Estimated Value
Purchase Details
Closed on
Aug 22, 2016
Sold by
Bussey Brian L and Bussey Brian Livingston
Bought by
Svetlana Imanova and Levin Zhanna
Purchase Details
Closed on
Jun 13, 2006
Sold by
Bussey Heather F
Bought by
Bussey Brian L
Purchase Details
Closed on
Jan 29, 1993
Sold by
Livingston Bussey Brian and Faux Heather
Bought by
Gracey Mary Faux and Bussey Heather F
Purchase Details
Closed on
Feb 27, 1989
Sold by
Secretary Of Housing & Urban Dev
Bought by
Faux Gracey Mary
Purchase Details
Closed on
Oct 13, 1988
Sold by
Alliance Mortgage Co
Bought by
Secretary Of Housing & Urban Dev
Purchase Details
Closed on
May 25, 1988
Sold by
Conversion Arapco
Bought by
Alliance Mortgage Co
Purchase Details
Closed on
Nov 1, 1984
Bought by
Conversion Arapco
Create a Home Valuation Report for This Property
The Home Valuation Report is an in-depth analysis detailing your home's value as well as a comparison with similar homes in the area
Home Values in the Area
Average Home Value in this Area
Purchase History
| Date | Buyer | Sale Price | Title Company |
|---|---|---|---|
| Yaw Mark A | $135,000 | Land Title Guarantee Co | |
| Svetlana Imanova | $114,750 | Land Title Guarantee Company | |
| Bussey Brian L | -- | None Available | |
| Gracey Mary Faux | -- | -- | |
| Livingston Bussey Brian | -- | -- | |
| Faux Gracey Mary | -- | -- | |
| Secretary Of Housing & Urban Dev | -- | -- | |
| Alliance Mortgage Co | -- | -- | |
| Conversion Arapco | -- | -- |
Source: Public Records
Tax History Compared to Growth
Tax History
| Year | Tax Paid | Tax Assessment Tax Assessment Total Assessment is a certain percentage of the fair market value that is determined by local assessors to be the total taxable value of land and additions on the property. | Land | Improvement |
|---|---|---|---|---|
| 2024 | $914 | $13,212 | -- | -- |
| 2023 | $914 | $13,212 | $0 | $0 |
| 2022 | $864 | $11,933 | $0 | $0 |
| 2021 | $870 | $11,933 | $0 | $0 |
| 2020 | $907 | $12,634 | $0 | $0 |
| 2019 | $875 | $12,634 | $0 | $0 |
| 2018 | $529 | $7,178 | $0 | $0 |
| 2017 | $522 | $7,178 | $0 | $0 |
| 2016 | $439 | $5,668 | $0 | $0 |
| 2015 | $418 | $5,668 | $0 | $0 |
| 2014 | -- | $3,471 | $0 | $0 |
| 2013 | -- | $3,930 | $0 | $0 |
Source: Public Records
Map
Nearby Homes
- 10650 E Tennessee Ave Unit 209
- 10650 E Tennessee Ave Unit 101
- 1011 S Ironton St Unit 509
- 1011 S Ironton St Unit 506
- 936 S Joliet St
- 10195 E Mississippi Ave
- 10752 E Exposition Ave Unit 230
- 10742 E Exposition Ave Unit 124
- 10732 E Exposition Ave Unit 222
- 1070 S Fulton St
- 10722 E Exposition Ave Unit 115
- 10762 E Exposition Ave Unit 237
- 10762 E Exposition Ave Unit 137
- 10772 E Exposition Ave Unit 342
- 10772 E Exposition Ave Unit 140
- 10772 E Exposition Ave Unit 141
- 10782 E Exposition Ave Unit 248
- 11196 E Ada Place
- 10792 E Exposition Ave Unit 355
- 10792 E Exposition Ave Unit 254
- 1011 S Ironton St Unit 511
- 1011 S Ironton St Unit 510
- 1011 S Ironton St Unit 507
- 1011 S Ironton St Unit 505
- 1011 S Ironton St Unit 504
- 1011 S Ironton St Unit 503
- 1011 S Ironton St Unit 502
- 1011 S Ironton St Unit 501
- 1011 S Ironton St Unit 411
- 1011 S Ironton St Unit 410
- 1011 S Ironton St Unit 409
- 1011 S Ironton St Unit 408
- 1011 S Ironton St Unit 407
- 1011 S Ironton St Unit 406
- 1011 S Ironton St Unit 405
- 1011 S Ironton St Unit 404
- 1011 S Ironton St Unit 403
- 1011 S Ironton St Unit 402
- 1011 S Ironton St Unit 401
- 1011 S Ironton St Unit 310