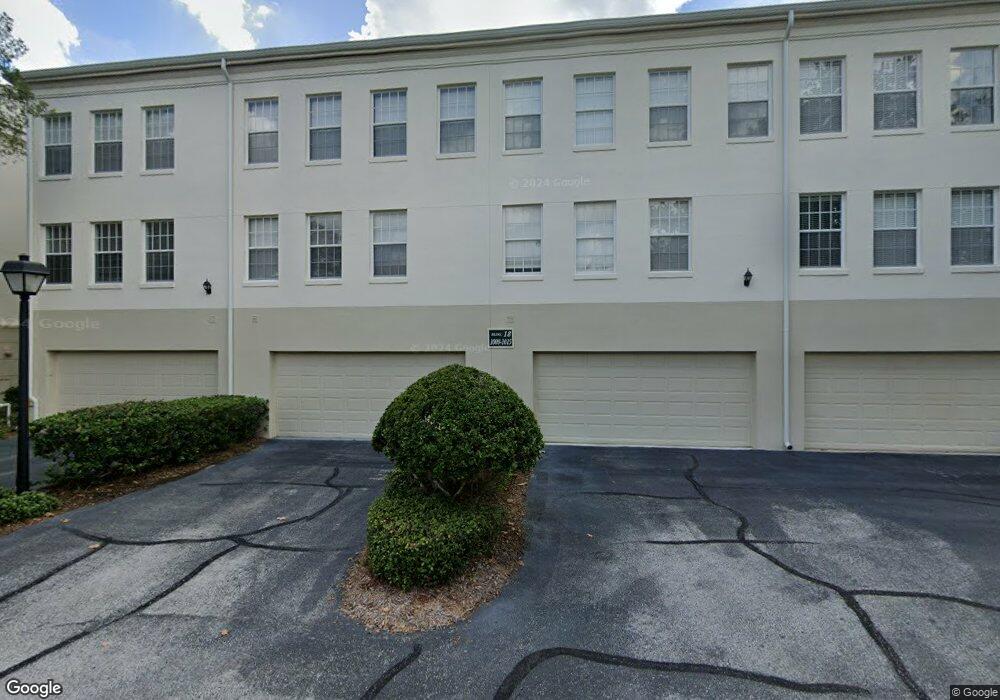
1011 Siena Park Blvd E Kissimmee, FL 34747
Estimated Value: $442,000 - $474,000
3
Beds
2
Baths
1,640
Sq Ft
$279/Sq Ft
Est. Value
About This Home
This home is located at 1011 Siena Park Blvd E, Kissimmee, FL 34747 and is currently estimated at $458,332, approximately $279 per square foot. 1011 Siena Park Blvd E is a home located in Osceola County with nearby schools including Celebration School, Celebration High School, and Montessori School Of Celebration.
Ownership History
Date
Name
Owned For
Owner Type
Purchase Details
Closed on
Apr 16, 2021
Sold by
Nguyen Jeff and Nguyen Cammy
Bought by
Alldredge Zen Jason and Alldredge Diana Irene
Current Estimated Value
Purchase Details
Closed on
Nov 14, 2019
Sold by
Fannie Mae
Bought by
Nguyen Jeff and Nguyen Cammy
Home Financials for this Owner
Home Financials are based on the most recent Mortgage that was taken out on this home.
Original Mortgage
$244,800
Interest Rate
3.5%
Mortgage Type
New Conventional
Purchase Details
Closed on
Mar 12, 2019
Sold by
Riffice Michael A
Bought by
Federal National Mortgage Assocaition
Purchase Details
Closed on
Jun 30, 2005
Sold by
Lexin Celebration Ii Llc
Bought by
Riffice Michael A and Riffice Ann
Home Financials for this Owner
Home Financials are based on the most recent Mortgage that was taken out on this home.
Original Mortgage
$320,000
Interest Rate
9.65%
Mortgage Type
Fannie Mae Freddie Mac
Create a Home Valuation Report for This Property
The Home Valuation Report is an in-depth analysis detailing your home's value as well as a comparison with similar homes in the area
Home Values in the Area
Average Home Value in this Area
Purchase History
| Date | Buyer | Sale Price | Title Company |
|---|---|---|---|
| Alldredge Zen Jason | $307,500 | Artesian Title Inc | |
| Nguyen Jeff | $272,000 | Bright Line Title Llc | |
| Federal National Mortgage Assocaition | -- | None Available | |
| Riffice Michael A | $320,000 | Equitable Title Agency Inc |
Source: Public Records
Mortgage History
| Date | Status | Borrower | Loan Amount |
|---|---|---|---|
| Previous Owner | Nguyen Jeff | $244,800 | |
| Previous Owner | Riffice Michael A | $320,000 |
Source: Public Records
Tax History Compared to Growth
Tax History
| Year | Tax Paid | Tax Assessment Tax Assessment Total Assessment is a certain percentage of the fair market value that is determined by local assessors to be the total taxable value of land and additions on the property. | Land | Improvement |
|---|---|---|---|---|
| 2024 | $4,849 | $447,100 | -- | $447,100 |
| 2023 | $4,849 | $283,140 | $0 | $0 |
| 2022 | $4,112 | $257,400 | $0 | $257,400 |
| 2021 | $3,695 | $219,800 | $0 | $219,800 |
| 2020 | $3,664 | $201,800 | $0 | $201,800 |
| 2019 | $3,571 | $192,500 | $0 | $192,500 |
| 2018 | $3,572 | $197,300 | $0 | $197,300 |
| 2017 | $3,325 | $171,800 | $0 | $171,800 |
| 2016 | $3,311 | $184,700 | $0 | $184,700 |
| 2015 | $3,234 | $181,700 | $0 | $181,700 |
| 2014 | $2,872 | $149,900 | $0 | $149,900 |
Source: Public Records
Map
Nearby Homes
- 742 Centervale Dr Unit 742
- 1017 Siena Park Blvd E
- 754 Centervale Dr
- 727 Siena Palm Dr
- 730 Siena Palm Dr Unit 201
- 730 Siena Palm Dr Unit 101
- 1021 Siena Park Blvd E Unit 204
- 1021 Siena Park Blvd E Unit 301
- 720 Siena Palm Dr Unit 101
- 754 Siena Palm Dr Unit 204
- 1020 Siena Park Blvd W Unit 304
- 1020 Siena Park Blvd W Unit 103
- 714 Siena Palm Dr Unit 205
- 714 Siena Palm Dr Unit 203
- 1001 Via Santae Ln Unit 201
- 711 Centervale Dr Unit 711
- 710 Siena Palm Dr Unit 102
- 1042 Waterside Dr
- 1038 Waterside Dr
- 1054 Waterside Dr
- 1011 Siena Park Blvd E Unit 1011
- 1015 Siena Park Blvd E
- 1013 Siena Park Blvd E
- 1013 Siena Park Blvd E Unit 1013
- 1009 Siena Park Blvd E
- 1007 Siena Park Blvd E
- 1003 Siena Park Blvd E Unit 1003
- 1003 Siena Park Blvd E Unit E
- 1003 Siena Park Blvd E
- 1019 Siena Park Blvd E Unit 1019
- 1019 Siena Park Blvd E
- 1005 Siena Park Blvd E
- 1001 Siena Park Blvd E
- 1001 Siena Park Blvd E Unit 1001
- 1010 Siena Park Blvd W Unit 91010
- 1000 Via Capri Ln Unit 201
- 1000 Via Capri Ln Unit 105
- 1000 Via Capri Ln Unit 104
- 1000 Via Capri Ln Unit 202
- 1000 Via Capri Ln Unit 204