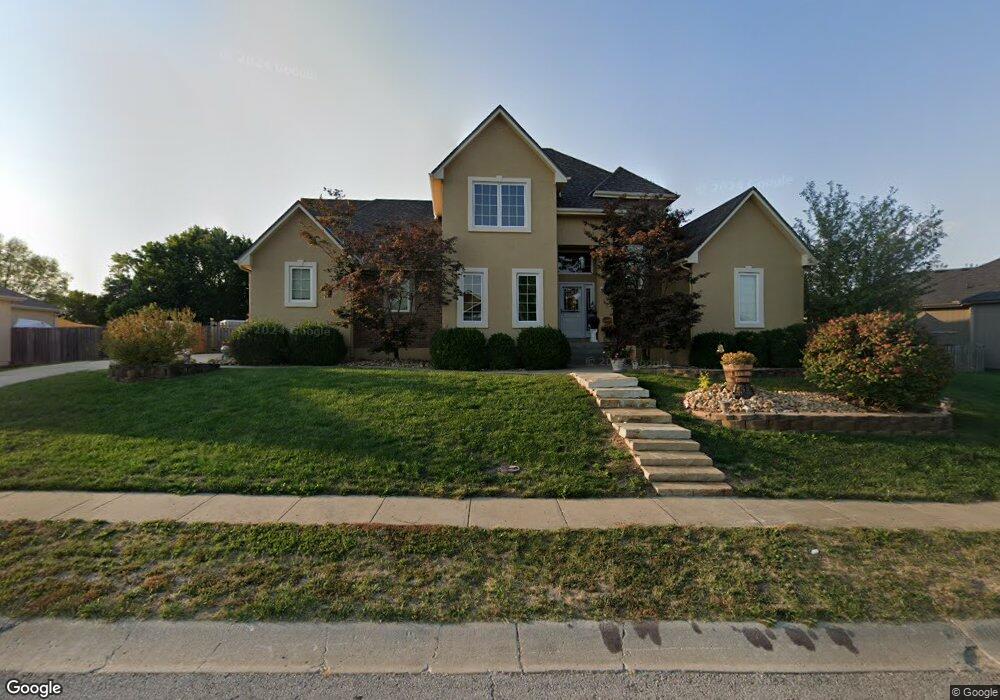
1011 SW Foxtail Dr Grain Valley, MO 64029
Estimated Value: $294,000 - $403,000
3
Beds
5
Baths
1,862
Sq Ft
$199/Sq Ft
Est. Value
About This Home
This home is located at 1011 SW Foxtail Dr, Grain Valley, MO 64029 and is currently estimated at $370,442, approximately $198 per square foot. 1011 SW Foxtail Dr is a home located in Jackson County with nearby schools including Grain Valley High School.
Ownership History
Date
Name
Owned For
Owner Type
Purchase Details
Closed on
Jul 31, 2006
Sold by
Cairer Chadlee D and Cairer Chadlee Damon
Bought by
Smith Sheila and Hale Randy
Current Estimated Value
Home Financials for this Owner
Home Financials are based on the most recent Mortgage that was taken out on this home.
Original Mortgage
$242,250
Outstanding Balance
$207,828
Interest Rate
8.55%
Mortgage Type
Purchase Money Mortgage
Estimated Equity
$162,614
Purchase Details
Closed on
Nov 4, 2005
Sold by
Cairer Aimee Renee
Bought by
Cairer Chadlee Damon
Home Financials for this Owner
Home Financials are based on the most recent Mortgage that was taken out on this home.
Original Mortgage
$249,750
Interest Rate
6.29%
Mortgage Type
Fannie Mae Freddie Mac
Purchase Details
Closed on
Mar 14, 2003
Sold by
Rpm Enterprises Inc
Bought by
Chamberlain Thomas M and Tlc Properties
Home Financials for this Owner
Home Financials are based on the most recent Mortgage that was taken out on this home.
Original Mortgage
$191,250
Interest Rate
5.86%
Mortgage Type
Construction
Create a Home Valuation Report for This Property
The Home Valuation Report is an in-depth analysis detailing your home's value as well as a comparison with similar homes in the area
Home Values in the Area
Average Home Value in this Area
Purchase History
| Date | Buyer | Sale Price | Title Company |
|---|---|---|---|
| Smith Sheila | -- | Title Enterprises | |
| Cairer Chadlee Damon | -- | Capital Title Agency Inc | |
| Chamberlain Thomas M | -- | Stewart Title Of Kansas City |
Source: Public Records
Mortgage History
| Date | Status | Borrower | Loan Amount |
|---|---|---|---|
| Open | Smith Sheila | $242,250 | |
| Previous Owner | Cairer Chadlee Damon | $249,750 | |
| Previous Owner | Chamberlain Thomas M | $191,250 |
Source: Public Records
Tax History Compared to Growth
Tax History
| Year | Tax Paid | Tax Assessment Tax Assessment Total Assessment is a certain percentage of the fair market value that is determined by local assessors to be the total taxable value of land and additions on the property. | Land | Improvement |
|---|---|---|---|---|
| 2025 | $4,875 | $59,049 | $8,292 | $50,757 |
| 2024 | $4,693 | $59,191 | $6,565 | $52,626 |
| 2023 | $4,693 | $59,191 | $5,930 | $53,261 |
| 2022 | $4,048 | $44,650 | $5,668 | $38,982 |
| 2021 | $3,953 | $44,650 | $5,668 | $38,982 |
| 2020 | $4,014 | $44,721 | $5,668 | $39,053 |
| 2019 | $3,932 | $44,721 | $5,668 | $39,053 |
| 2018 | $911,296 | $38,921 | $4,933 | $33,988 |
| 2017 | $3,569 | $38,921 | $4,933 | $33,988 |
| 2016 | $3,569 | $37,946 | $3,611 | $34,335 |
| 2014 | $3,525 | $37,202 | $3,540 | $33,662 |
Source: Public Records
Map
Nearby Homes
- 913 SW Abar Dr
- 1010 SW Cross Creek Dr
- 1200 SW Foxtail Dr
- 1203 SW Lakeview Dr
- 714 SW Brome Dr
- 1219 SW Windcrest Ct
- 1214 SW Windcrest Ct
- 636 SW Lakeview Dr
- 1215 SW Lone Star Ct
- 1309 SW Graystone Cir
- 801 SW Apple Grove Ct
- 115 E Old Us 40 Hwy N A
- 640 SW Crestview Dr
- 725 SW Tisha Ln
- 855 SW Ridgeview Dr
- 719 S Minter Rd
- 509 SW Joseph Ct
- 501 SW Creek Ridge Dr
- 601 SW Nelson Dr
- 621 SW Tisha Ln
- 1009 SW Foxtail Dr
- 1001 SW Stoney Point Dr
- 1005 SW Stoney Point Dr
- 1010 SW Foxtail Dr
- 1007 SW Foxtail Dr
- 1012 SW Foxtail Dr
- 1006 SW Foxtail Dr
- 1008 SW Foxtail Dr
- 1005 SW Foxtail Dr
- 1009 SW Stoney Point Dr
- 1014 SW Foxtail Dr
- 1012 W Ryan Rd
- 1000 SW Stoney Point Dr
- 1003 SW Foxtail Dr
- 914 SW Abar Dr
- 1004 SW Stoney Point Dr
- 1018 SW Foxtail Dr
- 1011 SW Stoney Point Dr
- 912 SW Abar Dr
- 1008 SW Stoney Point Dr