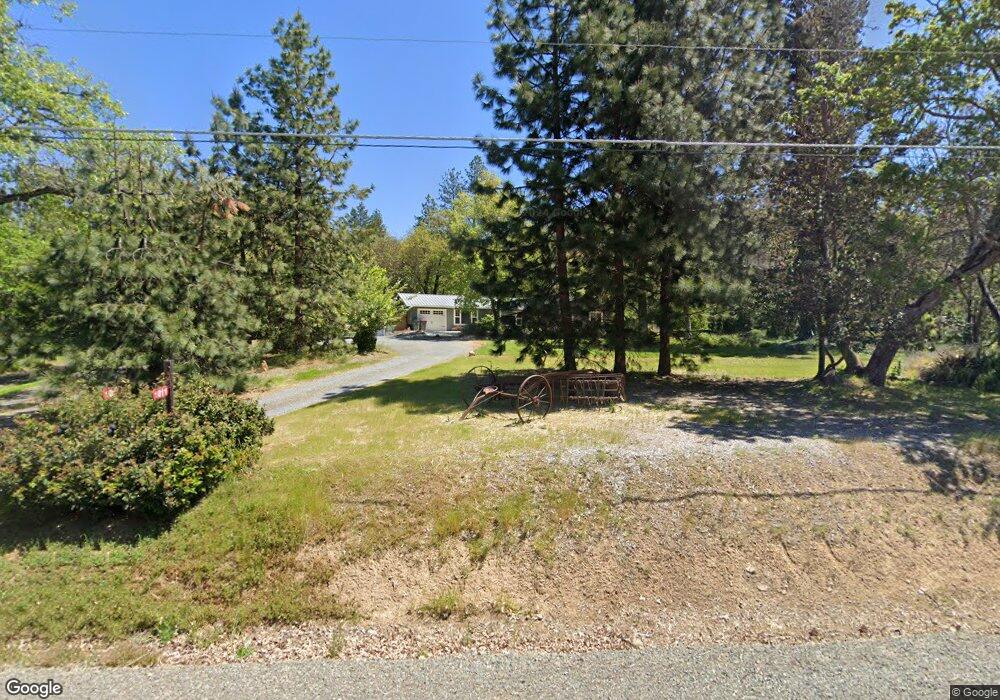
1011 Upper Applegate Rd Applegate, OR 97530
Ruch NeighborhoodEstimated Value: $514,000 - $636,000
3
Beds
2
Baths
1,716
Sq Ft
$342/Sq Ft
Est. Value
About This Home
This home is located at 1011 Upper Applegate Rd, Applegate, OR 97530 and is currently estimated at $586,887, approximately $342 per square foot. 1011 Upper Applegate Rd is a home with nearby schools including Ruch Outdoor Community School K-8, McLoughlin Middle School, and South Medford High School.
Ownership History
Date
Name
Owned For
Owner Type
Purchase Details
Closed on
Mar 29, 2022
Sold by
Janis May Duer Revocable Living Trust
Bought by
Ishikawa Amber and Maloney Peggy Maureen
Current Estimated Value
Home Financials for this Owner
Home Financials are based on the most recent Mortgage that was taken out on this home.
Original Mortgage
$617,500
Outstanding Balance
$577,200
Interest Rate
4.42%
Mortgage Type
New Conventional
Estimated Equity
$9,687
Purchase Details
Closed on
Apr 26, 2017
Sold by
Sibbitt Robert J
Bought by
Livin Duer Janis May and Livin Janis May Duer Revocable
Home Financials for this Owner
Home Financials are based on the most recent Mortgage that was taken out on this home.
Original Mortgage
$389,500
Interest Rate
4.3%
Mortgage Type
New Conventional
Purchase Details
Closed on
Nov 10, 2004
Sold by
Harter L I and Harter Frances M
Bought by
Cauvel Steven B and Cauvel Victoria E
Home Financials for this Owner
Home Financials are based on the most recent Mortgage that was taken out on this home.
Original Mortgage
$250,000
Interest Rate
5.79%
Mortgage Type
FHA
Create a Home Valuation Report for This Property
The Home Valuation Report is an in-depth analysis detailing your home's value as well as a comparison with similar homes in the area
Home Values in the Area
Average Home Value in this Area
Purchase History
| Date | Buyer | Sale Price | Title Company |
|---|---|---|---|
| Ishikawa Amber | $650,000 | First American Title | |
| Livin Duer Janis May | $410,000 | Amerititle | |
| Cauvel Steven B | $330,000 | First American |
Source: Public Records
Mortgage History
| Date | Status | Borrower | Loan Amount |
|---|---|---|---|
| Open | Ishikawa Amber | $617,500 | |
| Previous Owner | Livin Duer Janis May | $389,500 | |
| Previous Owner | Cauvel Steven B | $250,000 |
Source: Public Records
Tax History
| Year | Tax Paid | Tax Assessment Tax Assessment Total Assessment is a certain percentage of the fair market value that is determined by local assessors to be the total taxable value of land and additions on the property. | Land | Improvement |
|---|---|---|---|---|
| 2026 | $3,391 | $281,070 | -- | -- |
| 2025 | $3,316 | $272,890 | $112,310 | $160,580 |
| 2024 | $3,316 | $264,950 | $97,430 | $167,520 |
| 2023 | $3,163 | $257,240 | $94,590 | $162,650 |
| 2022 | $3,091 | $257,240 | $94,590 | $162,650 |
| 2021 | $3,016 | $249,750 | $91,830 | $157,920 |
| 2020 | $2,947 | $242,480 | $89,160 | $153,320 |
| 2019 | $2,881 | $228,570 | $84,040 | $144,530 |
| 2018 | $2,651 | $203,290 | $81,600 | $121,690 |
| 2017 | $2,516 | $203,290 | $81,600 | $121,690 |
| 2016 | $2,471 | $191,630 | $76,910 | $114,720 |
| 2015 | $2,392 | $191,630 | $76,910 | $114,720 |
| 2014 | $2,360 | $180,640 | $72,500 | $108,140 |
Source: Public Records
Map
Nearby Homes
- 75 Anna Laura Rd
- 588 Upper Applegate Rd
- 401 Tumbleweed Dr
- 233 Upper Applegate Rd
- 615 Tumbleweed Trail
- 1979 Upper Applegate Rd
- 145 Lomas Rd
- 324 China Gulch Rd
- 2389 Upper Applegate Rd
- 1100 Cantrall Rd
- 9395 Highway 238
- 1652 China Gulch Rd
- 0 China Gulch Rd Unit 220207669
- 0 Dog Fork Rd Unit 220213091
- 0 R Fork Forest Creek Rd Unit 11555343
- 5361 Jacksonville Hwy
- 5361 Oregon 238
- 5361 Highway 238
- 11677 Highway 238
- 11677 Oregon 238
- 1011 Upper Applegate Rd
- 909 Upper Applegate Rd
- 1049 Upper Applegate Rd
- 1049 Upp Applegate
- 21 Anna Laura Rd
- 855 Upper Applegate Rd
- 981 Upper Applegate Rd
- 981 Upper Applegate Rd
- 830 Upper Applegate Rd
- 833 Upper Applegate Rd
- 85 Anna Laura Rd
- 0 Applegate Area Unit 102974496
- 179 Anna Laura Rd
- 744 Upper Applegate Rd
- 801 Upper Applegate Rd
- 801 Upper Applegate Rd
- 927 Upper Applegate Rd
- 744 Applegate St
- 180 Tumbleweed Trail
- 781 Upper Applegate Rd
Your Personal Tour Guide
Ask me questions while you tour the home.