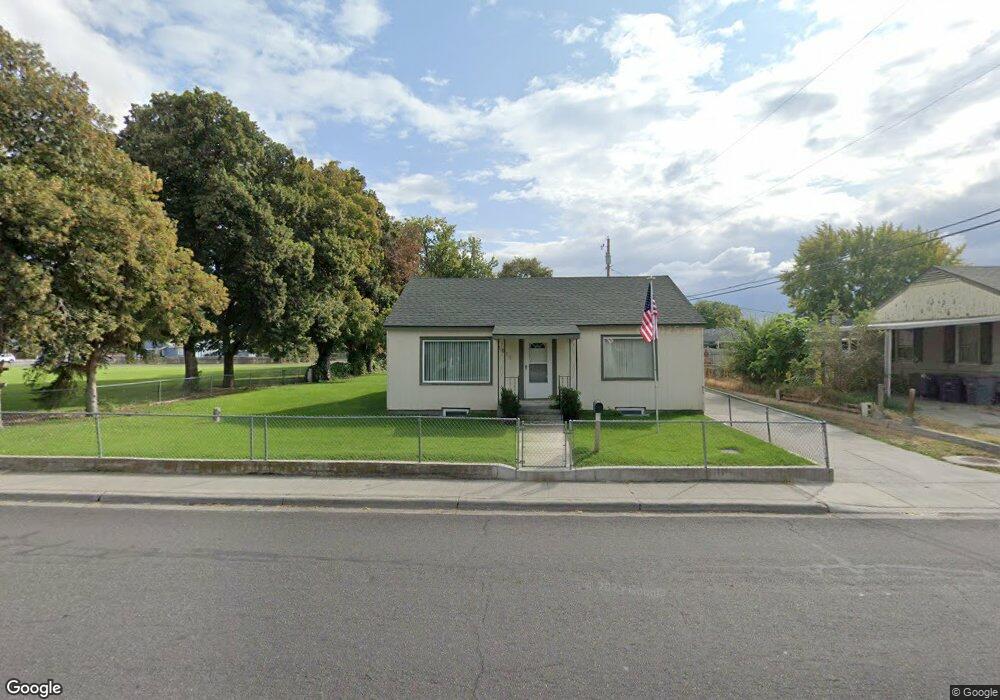
1011 van Giesen St Richland, WA 99354
Estimated Value: $326,639 - $411,000
3
Beds
1
Bath
2,123
Sq Ft
$165/Sq Ft
Est. Value
About This Home
This home is located at 1011 van Giesen St, Richland, WA 99354 and is currently estimated at $350,660, approximately $165 per square foot. 1011 van Giesen St is a home located in Benton County with nearby schools including Jason Lee Elementary School, Chief Joseph Middle School, and Richland High School.
Ownership History
Date
Name
Owned For
Owner Type
Purchase Details
Closed on
Jan 6, 2015
Sold by
Mcdonald Robert J
Bought by
Mcdonald Robert J and Mcdonald Tami M
Current Estimated Value
Home Financials for this Owner
Home Financials are based on the most recent Mortgage that was taken out on this home.
Original Mortgage
$132,200
Outstanding Balance
$44,700
Interest Rate
3.11%
Mortgage Type
New Conventional
Estimated Equity
$305,960
Purchase Details
Closed on
Mar 17, 2010
Sold by
Escujuri Kori R
Bought by
Mcdonald Robert J
Home Financials for this Owner
Home Financials are based on the most recent Mortgage that was taken out on this home.
Original Mortgage
$142,274
Interest Rate
5.25%
Mortgage Type
FHA
Purchase Details
Closed on
Sep 6, 2006
Sold by
Cook Lonnie H and Cook Lori A
Bought by
Escujuri Kori R
Home Financials for this Owner
Home Financials are based on the most recent Mortgage that was taken out on this home.
Original Mortgage
$28,725
Interest Rate
6.29%
Mortgage Type
Stand Alone Second
Create a Home Valuation Report for This Property
The Home Valuation Report is an in-depth analysis detailing your home's value as well as a comparison with similar homes in the area
Home Values in the Area
Average Home Value in this Area
Purchase History
| Date | Buyer | Sale Price | Title Company |
|---|---|---|---|
| Mcdonald Robert J | -- | Benton Franklin Title Co | |
| Mcdonald Robert J | $144,900 | Cascade Title | |
| Escujuri Kori R | $114,900 | Benton Franklin Titl |
Source: Public Records
Mortgage History
| Date | Status | Borrower | Loan Amount |
|---|---|---|---|
| Open | Mcdonald Robert J | $132,200 | |
| Closed | Mcdonald Robert J | $142,274 | |
| Previous Owner | Escujuri Kori R | $28,725 | |
| Previous Owner | Escujuri Kori R | $86,175 |
Source: Public Records
Tax History Compared to Growth
Tax History
| Year | Tax Paid | Tax Assessment Tax Assessment Total Assessment is a certain percentage of the fair market value that is determined by local assessors to be the total taxable value of land and additions on the property. | Land | Improvement |
|---|---|---|---|---|
| 2024 | $2,197 | $249,250 | $50,000 | $199,250 |
| 2023 | $2,197 | $231,930 | $50,000 | $181,930 |
| 2022 | $2,056 | $201,610 | $50,000 | $151,610 |
| 2021 | $1,890 | $184,270 | $50,000 | $134,270 |
| 2020 | $1,988 | $162,620 | $50,000 | $112,620 |
| 2019 | $1,683 | $161,920 | $21,600 | $140,320 |
| 2018 | $1,617 | $147,400 | $21,600 | $125,800 |
| 2017 | $1,414 | $118,370 | $21,600 | $96,770 |
| 2016 | $1,394 | $118,370 | $21,600 | $96,770 |
| 2015 | $1,420 | $118,370 | $21,600 | $96,770 |
| 2014 | -- | $118,370 | $21,600 | $96,770 |
| 2013 | -- | $118,370 | $21,600 | $96,770 |
Source: Public Records
Map
Nearby Homes
- 1603 Mahan Ave
- 1509 Kimball Ave
- 1511 Goethals Dr
- 1609 Judson Ave
- 609 Torbett St
- 1405 Marshall Ave
- 1510 Wilson St
- 1509 Potter Ave
- 509 Taylor St
- 1311 Goethals Dr Unit E
- 1323 Potter Ave
- 1314 Potter Ave
- 1904 Thompson St
- 1748 Duluth St
- 1914 Mahan Ave
- 1214 Potter Ave
- 2112-2114 Trippe St
- 1675 April Loop
- 1116 Thayer Dr
- 1118 Potter Ave
- 1013 van Giesen St
- 1526 Mahan Ave
- 1008 van Giesen St
- 1004 van Giesen St
- 1012 van Giesen St
- 1522 Mahan Ave
- 1016 van Giesen St
- 1520 Mahan Ave
- 1527 Mahan Ave
- 1002 van Giesen St
- 1527 Mahan Ave
- 1521 Stevens Dr
- 1518 Mahan Ave
- 1103 van Giesen St
- 1518 Mahan Ave
- 1103 van Giesen St
- 1523 Mahan Ave
- 1602 Mahan Ave
- 1603 Stevens Dr
- 1102 van Giesen St