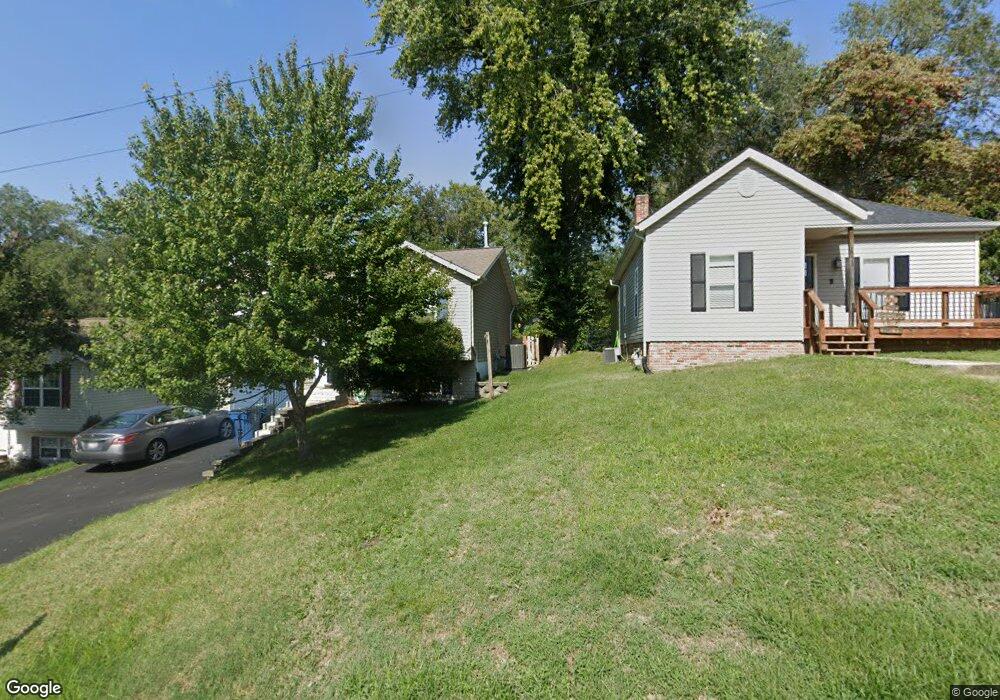
1011 Vine St Collinsville, IL 62234
Estimated Value: $197,000 - $204,000
3
Beds
2
Baths
896
Sq Ft
$224/Sq Ft
Est. Value
About This Home
This home is located at 1011 Vine St, Collinsville, IL 62234 and is currently estimated at $200,963, approximately $224 per square foot. 1011 Vine St is a home located in Madison County with nearby schools including Webster Elementary School, Dorris Intermediate School, and Collinsville Middle School.
Ownership History
Date
Name
Owned For
Owner Type
Purchase Details
Closed on
Dec 27, 2018
Sold by
Reeves Michael J and Ayala Ileana
Bought by
Ayala Ileana
Current Estimated Value
Home Financials for this Owner
Home Financials are based on the most recent Mortgage that was taken out on this home.
Original Mortgage
$119,515
Outstanding Balance
$105,500
Interest Rate
4.8%
Mortgage Type
VA
Estimated Equity
$95,463
Purchase Details
Closed on
Oct 7, 2004
Sold by
Turner Sean R
Bought by
Reeves Michael J and Reeves Ileana S
Home Financials for this Owner
Home Financials are based on the most recent Mortgage that was taken out on this home.
Original Mortgage
$115,500
Interest Rate
5.89%
Mortgage Type
Purchase Money Mortgage
Purchase Details
Closed on
Dec 19, 2003
Sold by
Dossett Connie Joan
Bought by
Dossett Donald Wayne
Purchase Details
Closed on
Dec 18, 2003
Sold by
Dossett Donald Wayne
Bought by
Turner Sean R
Create a Home Valuation Report for This Property
The Home Valuation Report is an in-depth analysis detailing your home's value as well as a comparison with similar homes in the area
Home Values in the Area
Average Home Value in this Area
Purchase History
| Date | Buyer | Sale Price | Title Company |
|---|---|---|---|
| Ayala Ileana | -- | Acquest Title | |
| Reeves Michael J | $115,500 | Abstracts & Titles Inc | |
| Dossett Donald Wayne | -- | Abstracts & Titles Inc | |
| Turner Sean R | $15,000 | Abstracts & Titles Inc |
Source: Public Records
Mortgage History
| Date | Status | Borrower | Loan Amount |
|---|---|---|---|
| Open | Ayala Ileana | $119,515 | |
| Previous Owner | Reeves Michael J | $115,500 |
Source: Public Records
Tax History Compared to Growth
Tax History
| Year | Tax Paid | Tax Assessment Tax Assessment Total Assessment is a certain percentage of the fair market value that is determined by local assessors to be the total taxable value of land and additions on the property. | Land | Improvement |
|---|---|---|---|---|
| 2024 | $2,832 | $60,170 | $7,200 | $52,970 |
| 2023 | $2,832 | $55,690 | $6,660 | $49,030 |
| 2022 | $2,832 | $50,030 | $5,960 | $44,070 |
| 2021 | $2,832 | $47,000 | $5,600 | $41,400 |
| 2020 | $2,711 | $44,840 | $5,340 | $39,500 |
| 2019 | $2,625 | $43,310 | $5,160 | $38,150 |
| 2018 | $2,580 | $41,410 | $4,870 | $36,540 |
| 2017 | $2,574 | $40,580 | $4,770 | $35,810 |
| 2016 | $2,702 | $40,580 | $4,770 | $35,810 |
| 2015 | $2,510 | $39,530 | $4,650 | $34,880 |
| 2014 | $2,510 | $39,530 | $4,650 | $34,880 |
| 2013 | $2,510 | $39,530 | $4,650 | $34,880 |
Source: Public Records
Map
Nearby Homes
- 921 Prospect St
- 919 Vine St
- 501 Spring
- 238 Mill St
- 404 E Church St
- 1210 Constance St
- 216 S Chestnut St
- 308 Brown Ave
- 617 N Morrison Ave
- 1120 Williams St
- 110 E Church St
- 1227 Ridge Ave
- 123 W Wickliffe Ave
- 892 Lester Ave
- 706 Illinois Ave
- 0 Strong Ave
- 121 S Seminary St
- 6430 Lebanon Rd
- 6506 Timber Lake Dr
- 580 N Guernsey St