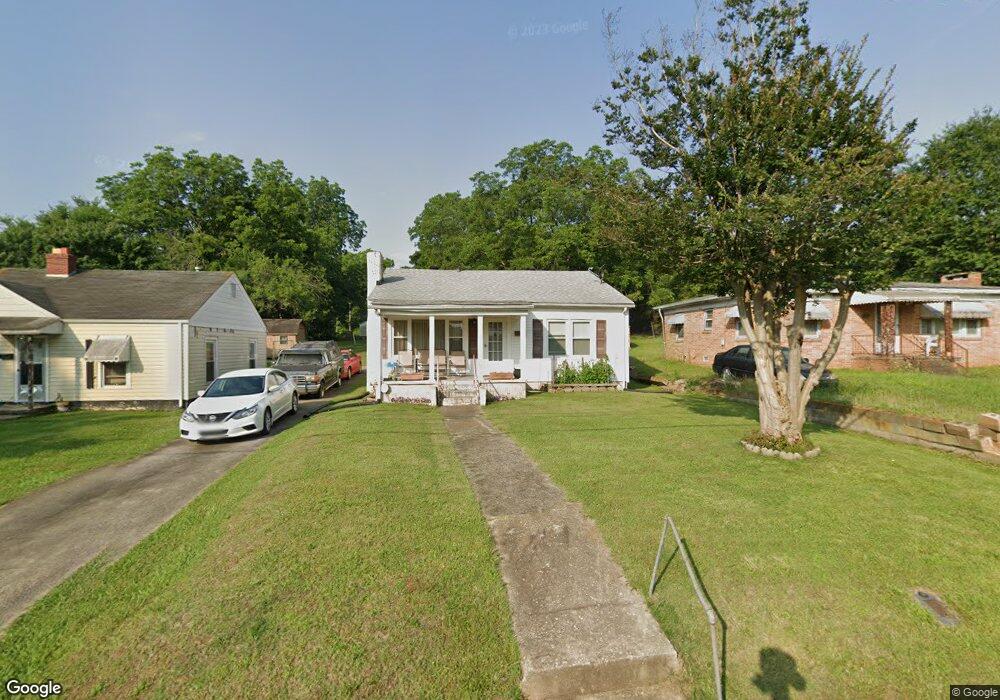
1011 W Fisher St Salisbury, NC 28144
Estimated Value: $187,000 - $259,000
--
Bed
1
Bath
1,481
Sq Ft
$150/Sq Ft
Est. Value
About This Home
This home is located at 1011 W Fisher St, Salisbury, NC 28144 and is currently estimated at $222,585, approximately $150 per square foot. 1011 W Fisher St is a home located in Rowan County with nearby schools including H D Isenberg Elementary, Knox Middle School, and North Rowan Middle School.
Ownership History
Date
Name
Owned For
Owner Type
Purchase Details
Closed on
Nov 20, 2023
Sold by
Jordan Melissa J and Jordan Bradford W
Bought by
Jordan Melissa J
Current Estimated Value
Purchase Details
Closed on
Dec 12, 2006
Sold by
Jordan Melissa J and Jordan Bradford W
Bought by
Jordan Bradford W and Jordan Melissa J
Purchase Details
Closed on
Jun 5, 2006
Sold by
Kluttz Pearl T
Bought by
Jordan Melissa J
Create a Home Valuation Report for This Property
The Home Valuation Report is an in-depth analysis detailing your home's value as well as a comparison with similar homes in the area
Home Values in the Area
Average Home Value in this Area
Purchase History
| Date | Buyer | Sale Price | Title Company |
|---|---|---|---|
| Jordan Melissa J | -- | None Listed On Document | |
| Jordan Melissa J | -- | None Listed On Document | |
| Jordan Bradford W | -- | None Available | |
| Jordan Melissa J | -- | None Available |
Source: Public Records
Tax History Compared to Growth
Tax History
| Year | Tax Paid | Tax Assessment Tax Assessment Total Assessment is a certain percentage of the fair market value that is determined by local assessors to be the total taxable value of land and additions on the property. | Land | Improvement |
|---|---|---|---|---|
| 2025 | $1,799 | $181,749 | $24,650 | $157,099 |
| 2024 | $1,799 | $181,749 | $24,650 | $157,099 |
| 2023 | $1,799 | $181,749 | $24,650 | $157,099 |
| 2022 | $1,270 | $119,014 | $21,250 | $97,764 |
| 2021 | $1,270 | $119,014 | $21,250 | $97,764 |
| 2020 | $1,270 | $119,014 | $21,250 | $97,764 |
| 2019 | $1,270 | $119,014 | $21,250 | $97,764 |
| 2018 | $977 | $92,472 | $21,250 | $71,222 |
| 2017 | $977 | $92,472 | $21,250 | $71,222 |
| 2016 | $983 | $92,472 | $21,250 | $71,222 |
| 2015 | $998 | $92,472 | $21,250 | $71,222 |
| 2014 | $1,018 | $96,043 | $21,250 | $74,793 |
Source: Public Records
Map
Nearby Homes
- 1017 W Fisher St
- 301 Lloyd St
- 1114 W Bank St
- 00 W Horah St
- 816 W Horah St
- 827 W Horah St
- 730 W Innes St
- 1304 W Horah St
- 1312 W Monroe St
- 720 Holmes St
- 617 W Horah St
- 307 Messner St
- 326 S Caldwell St
- 525 W Horah St Unit Lot 9
- 515 W Council St
- 1210 Kildare Dr Unit 80
- 1160 Kildare Dr Unit 76
- 1175 Kildare Dr Unit 3
- 408 S Ellis St
- 1027 Old Plank Rd
- 1011 W Fisher St
- 1043 W Fisher St
- 1047 W Fisher St
- 1005 W Fisher St
- 1035 W Fisher St
- 1027 W Fisher St
- 1023 W Fisher St
- 1019 W Fisher St
- 1003 W Fisher St
- 212 S Institute St
- 1001 W Fisher St
- 1034 W Fisher St
- 1032 W Fisher St
- 1026 W Fisher St
- 209 Lloyd St
- 209 Lloyd St
- 216 S Institute St
- 1004 W Fisher St
- 1016 W Fisher St
- 1016 W Fisher St