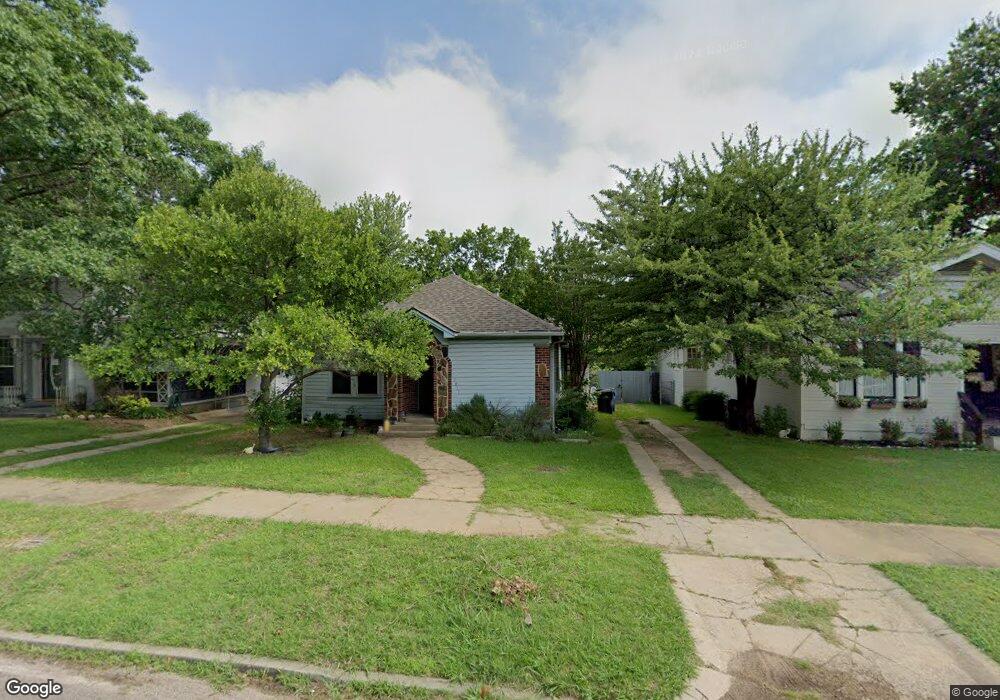
1011 W Walker St Denison, TX 75020
Estimated Value: $156,886 - $208,000
2
Beds
2
Baths
1,450
Sq Ft
$126/Sq Ft
Est. Value
About This Home
This home is located at 1011 W Walker St, Denison, TX 75020 and is currently estimated at $182,443, approximately $125 per square foot. 1011 W Walker St is a home located in Grayson County with nearby schools including Mayes Elementary School, Scott Middle School, and Denison High School.
Ownership History
Date
Name
Owned For
Owner Type
Purchase Details
Closed on
Sep 20, 2018
Sold by
Nichols Laura J and Nichols Stephen M
Bought by
Dryden William Bennett and Dryden Stephanie
Current Estimated Value
Purchase Details
Closed on
Oct 16, 2008
Sold by
Hogenson Hershel G
Bought by
Dryden William and Dryden Stephanie
Home Financials for this Owner
Home Financials are based on the most recent Mortgage that was taken out on this home.
Original Mortgage
$54,650
Interest Rate
6.35%
Mortgage Type
VA
Purchase Details
Closed on
Mar 4, 2008
Sold by
Rench Marguerite Louise Lou and Rench Jack R
Bought by
Hogenson Hershel G
Home Financials for this Owner
Home Financials are based on the most recent Mortgage that was taken out on this home.
Original Mortgage
$102,400
Interest Rate
5.47%
Mortgage Type
Purchase Money Mortgage
Create a Home Valuation Report for This Property
The Home Valuation Report is an in-depth analysis detailing your home's value as well as a comparison with similar homes in the area
Home Values in the Area
Average Home Value in this Area
Purchase History
| Date | Buyer | Sale Price | Title Company |
|---|---|---|---|
| Dryden William Bennett | -- | Red River Title Co | |
| Dryden William | -- | Grayson County Title | |
| Hogenson Hershel G | -- | Grayson County Title |
Source: Public Records
Mortgage History
| Date | Status | Borrower | Loan Amount |
|---|---|---|---|
| Previous Owner | Dryden William | $54,650 | |
| Previous Owner | Hogenson Hershel G | $102,400 |
Source: Public Records
Tax History
| Year | Tax Paid | Tax Assessment Tax Assessment Total Assessment is a certain percentage of the fair market value that is determined by local assessors to be the total taxable value of land and additions on the property. | Land | Improvement |
|---|---|---|---|---|
| 2025 | $3,495 | $148,522 | $43,125 | $105,397 |
| 2024 | $3,495 | $150,433 | $47,250 | $103,183 |
| 2023 | $3,477 | $153,447 | $40,875 | $112,572 |
| 2022 | $2,337 | $98,364 | $0 | $0 |
| 2021 | $2,255 | $89,422 | $20,250 | $69,172 |
| 2020 | $2,155 | $85,034 | $15,000 | $70,034 |
| 2019 | $2,044 | $90,167 | $12,450 | $77,717 |
| 2018 | $1,873 | $70,029 | $7,800 | $62,229 |
| 2017 | $1,717 | $66,822 | $6,975 | $59,847 |
| 2016 | $1,561 | $55,802 | $4,200 | $51,602 |
Source: Public Records
Map
Nearby Homes
- 709 N Chandler Ave
- 1008 W Walker St
- 1001 W Morton St
- 1200 W Walker St
- 728 W Walker St
- 417 N Scullin Ave
- 826 W Morton St
- 917 W Sears St
- 1111 W Sears St
- 829 W Sears St
- 1123 W Sears St
- 1208 Martin Luther King St
- 712 W Bond St
- 1018 W Sears St
- 522-526 W Bond St
- 759 N Eddy Ave
- 900 W Sears St
- 317 N Scullin Ave
- 1231 W Morton St
- 631 W Walker St
- 1017 W Walker St
- 715 N Chandler Ave
- 1019 W Walker St
- 1012 W Johnson St
- 1025 W Walker St
- 717 N Chandler Ave
- 1024 W Johnson St
- 1014 W Walker St
- 1002 W Walker St
- 1031 W Walker St
- 1018 W Walker St
- 929 W Walker St
- 1020 W Walker St
- 1030 W Johnson St
- 622 N Chandler Ave
- 714 N Chandler Ave
- 1026 W Walker St
- 927 W Walker St
- 1030 W Walker St
- 720 N Chandler Ave
Your Personal Tour Guide
Ask me questions while you tour the home.