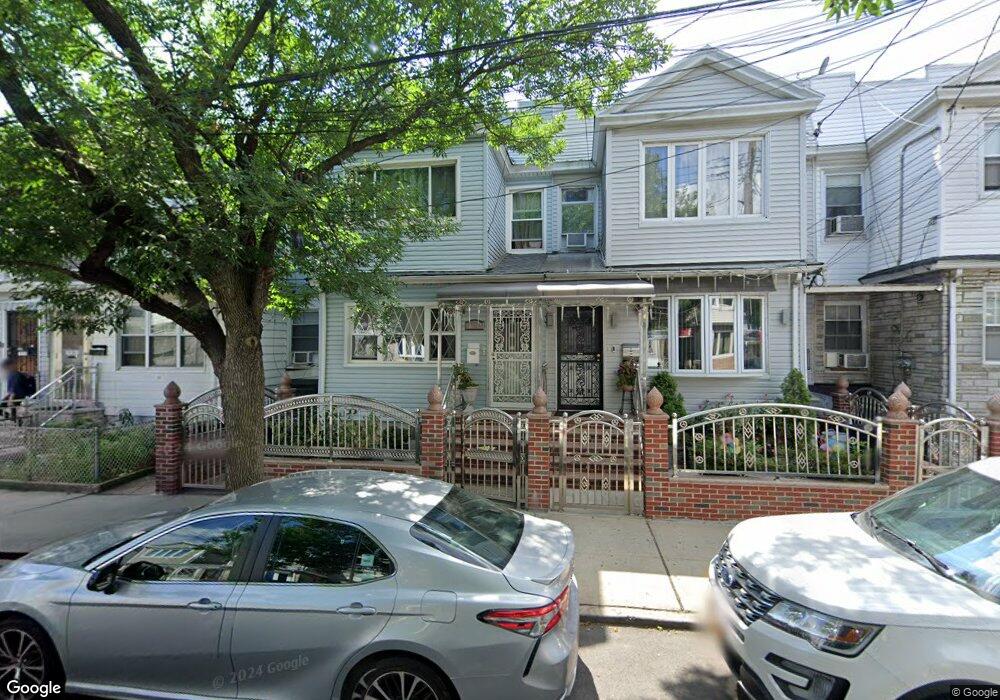
10110 80th St Ozone Park, NY 11416
Ozone Park NeighborhoodEstimated Value: $805,202 - $949,000
--
Bed
--
Bath
2,070
Sq Ft
$433/Sq Ft
Est. Value
About This Home
This home is located at 10110 80th St, Ozone Park, NY 11416 and is currently estimated at $896,551, approximately $433 per square foot. 10110 80th St is a home located in Queens County with nearby schools including P.S. 63 - Old South, Jhs 210 Elizabeth Blackwell, and Cypress Hills Ascend Charter Lower School.
Ownership History
Date
Name
Owned For
Owner Type
Purchase Details
Closed on
Feb 12, 2024
Sold by
Parasram Rookmin and Singh Cyranie S
Bought by
Singh Dhanie and Singh Paulette
Current Estimated Value
Purchase Details
Closed on
May 9, 2001
Sold by
Derenthal Robert J and Derenthal Cecelia L
Bought by
Singh Paulette and Etwaroo Rambarran
Home Financials for this Owner
Home Financials are based on the most recent Mortgage that was taken out on this home.
Original Mortgage
$200,970
Outstanding Balance
$74,416
Interest Rate
7.08%
Mortgage Type
Purchase Money Mortgage
Estimated Equity
$822,135
Create a Home Valuation Report for This Property
The Home Valuation Report is an in-depth analysis detailing your home's value as well as a comparison with similar homes in the area
Home Values in the Area
Average Home Value in this Area
Purchase History
| Date | Buyer | Sale Price | Title Company |
|---|---|---|---|
| Singh Dhanie | -- | -- | |
| Singh Dhanie | -- | -- | |
| Singh Paulette | -- | -- | |
| Singh Paulette | -- | -- |
Source: Public Records
Mortgage History
| Date | Status | Borrower | Loan Amount |
|---|---|---|---|
| Open | Singh Paulette | $200,970 | |
| Closed | Singh Paulette | $200,970 |
Source: Public Records
Tax History Compared to Growth
Tax History
| Year | Tax Paid | Tax Assessment Tax Assessment Total Assessment is a certain percentage of the fair market value that is determined by local assessors to be the total taxable value of land and additions on the property. | Land | Improvement |
|---|---|---|---|---|
| 2025 | $6,886 | $37,763 | $11,178 | $26,585 |
| 2024 | $6,898 | $35,686 | $11,753 | $23,933 |
| 2023 | $6,541 | $33,966 | $11,503 | $22,463 |
| 2022 | $6,150 | $48,120 | $16,500 | $31,620 |
| 2021 | $6,490 | $41,520 | $16,500 | $25,020 |
| 2020 | $6,365 | $38,940 | $16,500 | $22,440 |
| 2019 | $5,928 | $40,800 | $16,500 | $24,300 |
| 2018 | $5,472 | $28,305 | $12,434 | $15,871 |
| 2017 | $5,178 | $26,872 | $13,838 | $13,034 |
| 2016 | $5,062 | $26,872 | $13,838 | $13,034 |
| 2015 | $2,838 | $26,224 | $16,224 | $10,000 |
| 2014 | $2,838 | $24,782 | $14,592 | $10,190 |
Source: Public Records
Map
Nearby Homes