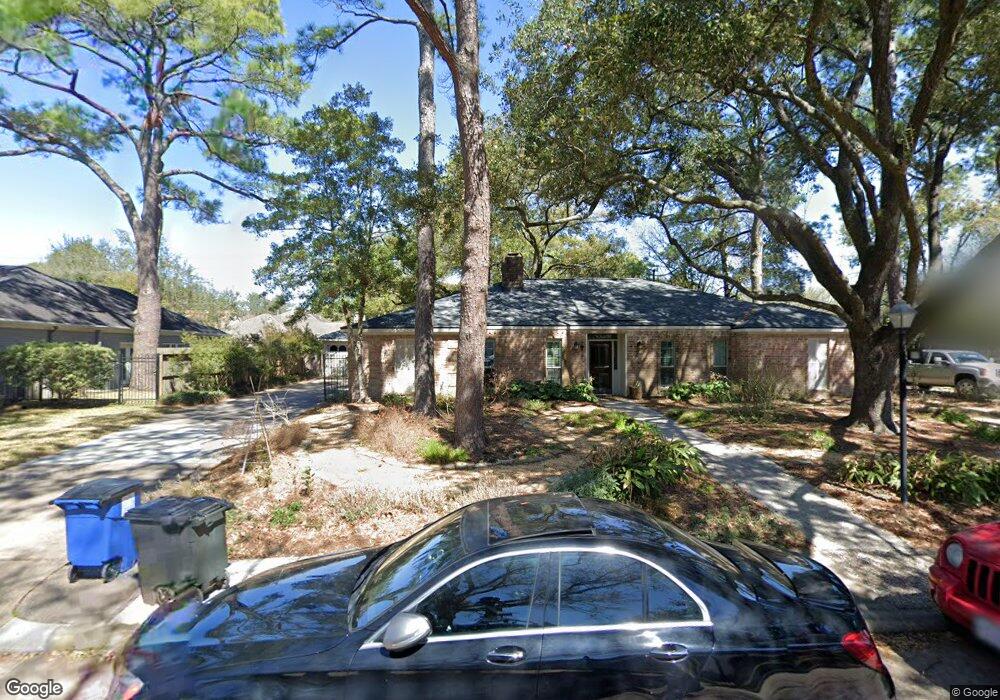
10110 Briar Rose Dr Houston, TX 77042
Briar Forest NeighborhoodEstimated Value: $709,576 - $898,000
4
Beds
2
Baths
2,150
Sq Ft
$367/Sq Ft
Est. Value
About This Home
This home is located at 10110 Briar Rose Dr, Houston, TX 77042 and is currently estimated at $788,894, approximately $366 per square foot. 10110 Briar Rose Dr is a home located in Harris County with nearby schools including Walnut Bend Elementary School, Paul Revere Middle School, and Westside High School.
Ownership History
Date
Name
Owned For
Owner Type
Purchase Details
Closed on
Feb 2, 1998
Sold by
Hill Stephen W and Hill Lori T
Bought by
Nisenbaum Howard A and Lerner Nancy
Current Estimated Value
Home Financials for this Owner
Home Financials are based on the most recent Mortgage that was taken out on this home.
Original Mortgage
$207,200
Outstanding Balance
$36,615
Interest Rate
6.98%
Estimated Equity
$752,279
Purchase Details
Closed on
Mar 7, 1997
Sold by
Bryant Robert E and Bryant Amy T
Bought by
Hill Stephen W
Home Financials for this Owner
Home Financials are based on the most recent Mortgage that was taken out on this home.
Original Mortgage
$188,000
Interest Rate
7.89%
Purchase Details
Closed on
Sep 27, 1993
Sold by
Bischoff Michael L and Bischoff Colleen F
Bought by
Bryant Robert E and Bryant Amy T
Home Financials for this Owner
Home Financials are based on the most recent Mortgage that was taken out on this home.
Original Mortgage
$188,374
Interest Rate
7.11%
Create a Home Valuation Report for This Property
The Home Valuation Report is an in-depth analysis detailing your home's value as well as a comparison with similar homes in the area
Home Values in the Area
Average Home Value in this Area
Purchase History
| Date | Buyer | Sale Price | Title Company |
|---|---|---|---|
| Nisenbaum Howard A | -- | Houston Title Company 700 | |
| Hill Stephen W | -- | Commonwealth Land Title Co | |
| Bryant Robert E | -- | -- |
Source: Public Records
Mortgage History
| Date | Status | Borrower | Loan Amount |
|---|---|---|---|
| Open | Nisenbaum Howard A | $207,200 | |
| Previous Owner | Hill Stephen W | $188,000 | |
| Previous Owner | Bryant Robert E | $188,374 | |
| Closed | Nisenbaum Howard A | $25,900 |
Source: Public Records
Tax History Compared to Growth
Tax History
| Year | Tax Paid | Tax Assessment Tax Assessment Total Assessment is a certain percentage of the fair market value that is determined by local assessors to be the total taxable value of land and additions on the property. | Land | Improvement |
|---|---|---|---|---|
| 2025 | $6,173 | $693,483 | $410,175 | $283,308 |
| 2024 | $6,173 | $632,121 | $410,175 | $221,946 |
| 2023 | $6,173 | $617,255 | $410,175 | $207,080 |
| 2022 | $13,222 | $608,610 | $410,175 | $198,435 |
| 2021 | $12,723 | $553,615 | $410,175 | $143,440 |
| 2020 | $12,017 | $496,253 | $410,175 | $86,078 |
| 2019 | $12,464 | $492,565 | $410,175 | $82,390 |
| 2018 | $9,696 | $491,427 | $236,990 | $254,437 |
| 2017 | $12,426 | $491,427 | $236,990 | $254,437 |
| 2016 | $11,712 | $491,427 | $236,990 | $254,437 |
| 2015 | $7,734 | $488,000 | $236,990 | $251,010 |
| 2014 | $7,734 | $458,219 | $200,530 | $257,689 |
Source: Public Records
Map
Nearby Homes
- 10118 Briar Rose Dr
- 10042 Briar Forest Dr
- 10034 Briar Forest Dr
- 10031 Inwood Dr
- 10276 Briar Forest Dr Unit 25
- 10317 Briar Forest Dr Unit 214
- 10324 Briar Forest Dr Unit 28
- 10121 Valley Forge Dr
- 1691 W Sam Houston Pkwy S
- 10303 Chevy Chase Dr
- 1537 W Sam Houston Pkwy S
- 10378 Briar Forest Dr Unit 32/5
- 10211 Olympia Dr
- 10203 Meadow Lake Ln
- 2219 Briar Branch Dr
- 10206 Burgoyne Rd
- 10034 Bordley Dr
- 10212 Longmont Dr Unit 44/7
- 10218 Burgoyne Rd
- 10010 Bordley Dr
- 10106 Briar Rose Dr
- 10114 Briar Rose Dr
- 10111 Briar Forest Dr
- 10115 Briar Forest Dr
- 10107 Briar Forest Dr
- 10107 Briar Rose Dr
- 10111 Briar Rose Dr
- 10102 Briar Rose Dr
- 10119 Briar Forest Dr
- 10103 Briar Rose Dr
- 10115 Briar Rose Dr
- 10103 Briar Forest Dr
- 10122 Briar Rose Dr
- 10046 Briar Rose Dr
- 10123 Briar Forest Dr
- 10119 Briar Rose Dr
- 10106 Inwood Dr
- 10110 Inwood Dr
- 10047 Briar Forest Dr
- 10102 Inwood Dr