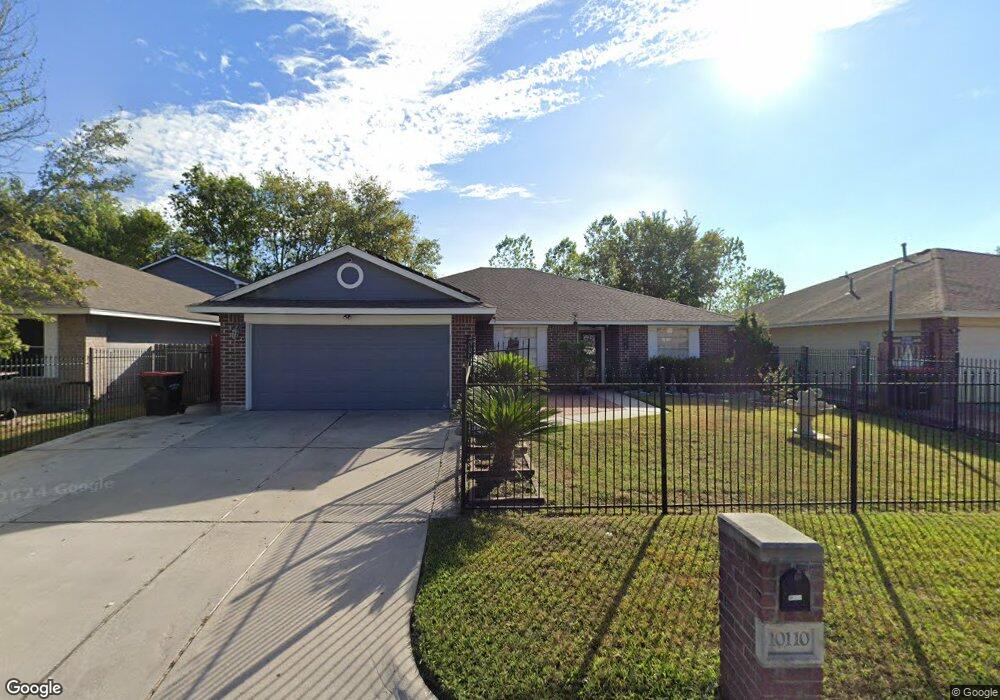
10110 Rosbrook Dr Houston, TX 77038
North Houston NeighborhoodEstimated Value: $244,000 - $268,000
3
Beds
2
Baths
2,070
Sq Ft
$125/Sq Ft
Est. Value
About This Home
This home is located at 10110 Rosbrook Dr, Houston, TX 77038 and is currently estimated at $257,880, approximately $124 per square foot. 10110 Rosbrook Dr is a home located in Harris County with nearby schools including Jerry Keeble Ec/Pre-K, Gray Elementary School, and Aldine Ninth Grade School.
Ownership History
Date
Name
Owned For
Owner Type
Purchase Details
Closed on
Apr 23, 2014
Sold by
Doan Bang V
Bought by
Gorostieta Marco A and Peralta Elizabeth
Current Estimated Value
Home Financials for this Owner
Home Financials are based on the most recent Mortgage that was taken out on this home.
Original Mortgage
$116,809
Outstanding Balance
$88,495
Interest Rate
4.25%
Mortgage Type
FHA
Estimated Equity
$169,385
Purchase Details
Closed on
Feb 25, 2002
Sold by
Parkstone Building Company Lp
Bought by
Doan Bang and Pham Tu Ngoc
Home Financials for this Owner
Home Financials are based on the most recent Mortgage that was taken out on this home.
Original Mortgage
$55,200
Interest Rate
7.05%
Purchase Details
Closed on
Jan 30, 2002
Sold by
Chatwood Place Lp
Bought by
Parkstone Building Company Lp
Home Financials for this Owner
Home Financials are based on the most recent Mortgage that was taken out on this home.
Original Mortgage
$55,200
Interest Rate
7.05%
Create a Home Valuation Report for This Property
The Home Valuation Report is an in-depth analysis detailing your home's value as well as a comparison with similar homes in the area
Home Values in the Area
Average Home Value in this Area
Purchase History
| Date | Buyer | Sale Price | Title Company |
|---|---|---|---|
| Gorostieta Marco A | -- | None Available | |
| Doan Bang | -- | Commonwealth Title | |
| Parkstone Building Company Lp | -- | -- |
Source: Public Records
Mortgage History
| Date | Status | Borrower | Loan Amount |
|---|---|---|---|
| Open | Gorostieta Marco A | $116,809 | |
| Previous Owner | Doan Bang | $55,200 |
Source: Public Records
Tax History Compared to Growth
Tax History
| Year | Tax Paid | Tax Assessment Tax Assessment Total Assessment is a certain percentage of the fair market value that is determined by local assessors to be the total taxable value of land and additions on the property. | Land | Improvement |
|---|---|---|---|---|
| 2025 | $5,269 | $272,358 | $34,419 | $237,939 |
| 2024 | $5,269 | $272,358 | $34,419 | $237,939 |
| 2023 | $5,269 | $272,358 | $34,419 | $237,939 |
| 2022 | $3,527 | $153,180 | $23,392 | $129,788 |
| 2021 | $3,678 | $153,180 | $23,392 | $129,788 |
| 2020 | $3,916 | $153,180 | $23,392 | $129,788 |
| 2019 | $3,837 | $144,306 | $23,392 | $120,914 |
| 2018 | $2,081 | $144,908 | $13,367 | $131,541 |
| 2017 | $3,733 | $144,908 | $13,367 | $131,541 |
| 2016 | $3,389 | $131,539 | $13,367 | $118,172 |
| 2015 | $2,709 | $131,539 | $13,367 | $118,172 |
| 2014 | $2,709 | $105,000 | $13,367 | $91,633 |
Source: Public Records
Map
Nearby Homes
- 10026 Lasaber Ct
- 10134 Lasaber Ct
- 1006 Fruitvale Dr
- 1010 Francitas Dr
- 10226 Ella Falls Blvd
- 1022 Progreso Dr
- 1138 Cherry Spring Dr
- 939 Point Blank Dr
- 9710 Debbie Ln
- 1506 Wilshire Park Dr
- 1219 Pilot Point Dr
- 1019 Castolan Dr
- 1327 Fallbrook Dr
- 10519 Pleasanton Dr
- 00 Fallbrook Dr
- 0 W Mt Houston Rd Unit 90464120
- 0 Veterans Memorial Rd Unit 43555293
- 10558 Pleasanton Dr
- 2115 Havencrest Dr
- 2203 Chalet Rd
- 10114 Rosbrook Dr
- 10106 Rosbrook Dr
- 10118 Rosbrook Dr
- 10102 Rosbrook Dr
- 10111 Rosbrook Dr
- 10107 Rosbrook Dr
- 10115 Rosbrook Dr
- 10122 Rosbrook Dr
- 10119 Rosbrook Dr
- 10103 Rosbrook Dr
- 10106 Rosbrook Ct
- 10123 Rosbrook Dr
- 10044 Rosbrook Dr
- 10126 Rosbrook Dr
- 10110 Ridgecoral Ct
- 10106 Ridgecoral Ct
- 10051 Rosbrook Dr
- 10114 Ridgecoral Ct
- 10102 Ridgecoral Ct
- 10042 Rosbrook Dr