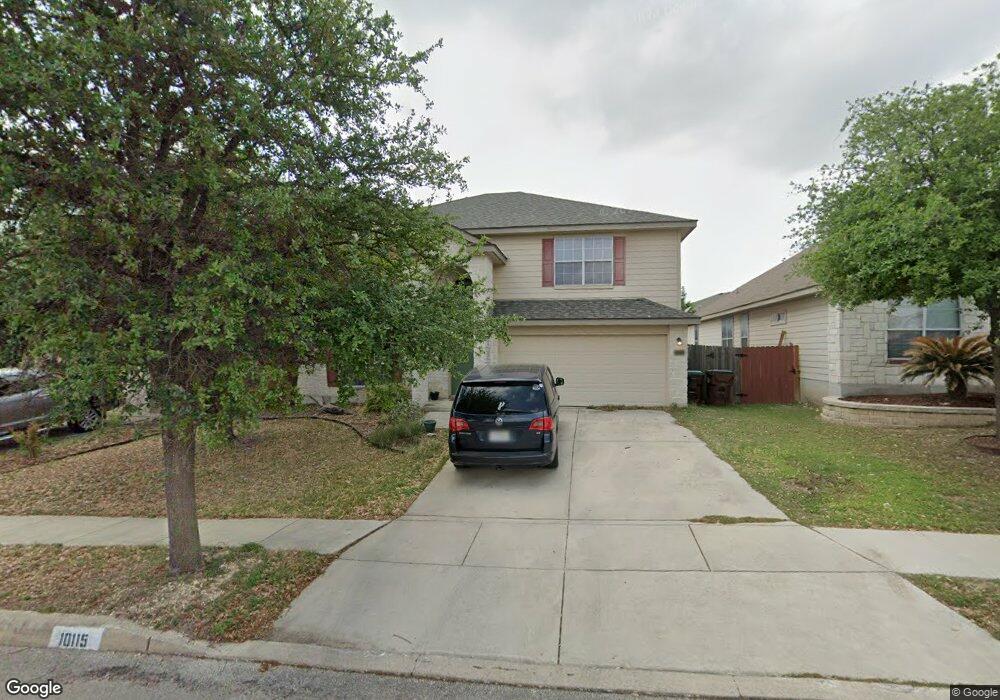
10115 Wildhorse Pkwy San Antonio, TX 78254
Estimated Value: $306,718 - $342,000
4
Beds
3
Baths
2,517
Sq Ft
$130/Sq Ft
Est. Value
About This Home
This home is located at 10115 Wildhorse Pkwy, San Antonio, TX 78254 and is currently estimated at $326,430, approximately $129 per square foot. 10115 Wildhorse Pkwy is a home located in Bexar County with nearby schools including Krueger Elementary School, Jefferson Middle School, and School of Science and Technology Hill Country.
Ownership History
Date
Name
Owned For
Owner Type
Purchase Details
Closed on
May 31, 2011
Sold by
Price Gary N and Price Marie Laure D
Bought by
Laney Jared A and Laney Laurel E
Current Estimated Value
Home Financials for this Owner
Home Financials are based on the most recent Mortgage that was taken out on this home.
Original Mortgage
$178,762
Outstanding Balance
$124,500
Interest Rate
4.85%
Mortgage Type
VA
Estimated Equity
$201,930
Purchase Details
Closed on
Jun 22, 2004
Sold by
Continental Homes Of Texas Lp
Bought by
Price Gary N
Home Financials for this Owner
Home Financials are based on the most recent Mortgage that was taken out on this home.
Original Mortgage
$128,799
Interest Rate
6.32%
Mortgage Type
Purchase Money Mortgage
Create a Home Valuation Report for This Property
The Home Valuation Report is an in-depth analysis detailing your home's value as well as a comparison with similar homes in the area
Home Values in the Area
Average Home Value in this Area
Purchase History
| Date | Buyer | Sale Price | Title Company |
|---|---|---|---|
| Laney Jared A | -- | Fidelity National Title | |
| Price Gary N | -- | -- |
Source: Public Records
Mortgage History
| Date | Status | Borrower | Loan Amount |
|---|---|---|---|
| Open | Laney Jared A | $178,762 | |
| Previous Owner | Price Gary N | $128,799 | |
| Closed | Price Gary N | $16,100 |
Source: Public Records
Tax History Compared to Growth
Tax History
| Year | Tax Paid | Tax Assessment Tax Assessment Total Assessment is a certain percentage of the fair market value that is determined by local assessors to be the total taxable value of land and additions on the property. | Land | Improvement |
|---|---|---|---|---|
| 2025 | $5,916 | $319,370 | $55,900 | $263,470 |
| 2024 | $5,916 | $319,370 | $55,900 | $263,470 |
| 2023 | $5,916 | $326,220 | $55,900 | $270,320 |
| 2022 | $6,284 | $309,370 | $46,600 | $262,770 |
| 2021 | $5,107 | $242,590 | $42,370 | $200,220 |
| 2020 | $5,004 | $232,690 | $42,370 | $190,320 |
| 2019 | $5,024 | $226,240 | $33,690 | $192,550 |
| 2018 | $4,712 | $212,040 | $33,690 | $178,350 |
| 2017 | $4,576 | $205,490 | $33,690 | $171,800 |
| 2016 | $4,450 | $199,810 | $33,690 | $166,120 |
| 2015 | $3,987 | $189,810 | $33,690 | $156,120 |
| 2014 | $3,987 | $178,010 | $0 | $0 |
Source: Public Records
Map
Nearby Homes
- 10523 Timber Country
- 9950 Sandlet Trail
- 9951 Sandlet Trail
- 10322 Filly Valley
- 9807 Sandlet Trail
- 9607 Country Shadow
- 10225 Braun Rd Unit A201
- 10225 Braun Rd Unit A310
- 10225 Braun Rd Unit C601
- 10225 Braun Rd Unit A302
- 10225 Braun Rd Unit A309
- 10706 Pharaoh Run
- 10707 Pharaoh Run
- 10627 Arabian Sands
- 10707 Arabian Sands
- 10814 Shetland Hills
- 10767 Pharaoh Run
- 10322 Alsfeld Ranch
- 9427 Velvet Spring
- 10418 Alsfeld Ranch
- 10119 Wildhorse Pkwy
- 10111 Wildhorse Pkwy
- 10123 Wildhorse Pkwy
- 10107 Wildhorse Pkwy
- 10114 Sandlet Trail
- 10118 Sandlet Trail
- 10110 Sandlet Trail
- 10127 Wildhorse Pkwy
- 10103 Wildhorse Pkwy
- 10106 Sandlet Trail
- 10102 Sandlet Trail
- 10122 Sandlet Trail
- 10407 Fairlong Trail
- 10510 Timber Country
- 10411 Fairlong Trail
- 10502 Timber Country
- 10514 Timber Country Unit 1
- 10403 Fairlong Trail
- 10415 Fairlong Trail
- 10118 Wildhorse Pkwy