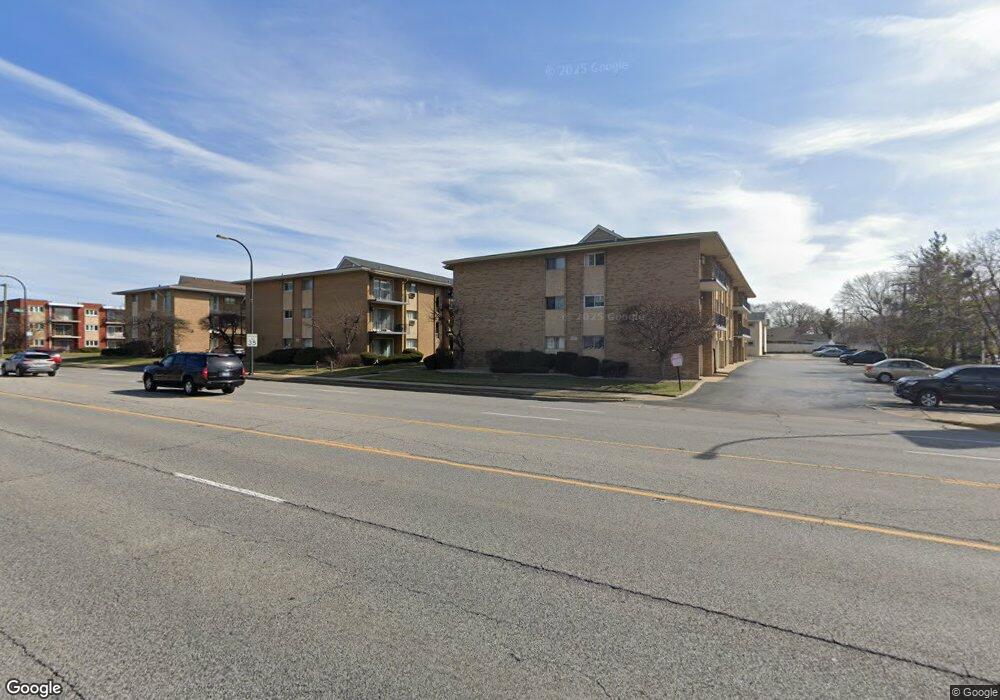
10117 S Cicero Ave Unit 101172 Oak Lawn, IL 60453
Estimated Value: $112,000 - $142,000
2
Beds
1
Bath
677
Sq Ft
$191/Sq Ft
Est. Value
About This Home
This home is located at 10117 S Cicero Ave Unit 101172, Oak Lawn, IL 60453 and is currently estimated at $129,188, approximately $190 per square foot. 10117 S Cicero Ave Unit 101172 is a home located in Cook County with nearby schools including Sward Elementary School, Kolmar Avenue Elementary School, and J Covington Elementary School.
Ownership History
Date
Name
Owned For
Owner Type
Purchase Details
Closed on
May 20, 2022
Sold by
First Midwest Bank
Bought by
Maldonado Ricardo
Current Estimated Value
Home Financials for this Owner
Home Financials are based on the most recent Mortgage that was taken out on this home.
Original Mortgage
$85,500
Outstanding Balance
$71,262
Interest Rate
4.63%
Mortgage Type
New Conventional
Estimated Equity
$57,926
Purchase Details
Closed on
Nov 29, 2011
Sold by
Castillo Pamela J and Mejia Pamela J
Bought by
First Midwest Bank and Trust #9151
Purchase Details
Closed on
Jun 16, 2000
Sold by
Nelson Donna J and Strock Donald J
Bought by
Castillo Pamela J
Home Financials for this Owner
Home Financials are based on the most recent Mortgage that was taken out on this home.
Original Mortgage
$57,950
Interest Rate
8.64%
Purchase Details
Closed on
Feb 5, 1999
Sold by
Cole Taylor Bank
Bought by
Strock Rose
Create a Home Valuation Report for This Property
The Home Valuation Report is an in-depth analysis detailing your home's value as well as a comparison with similar homes in the area
Home Values in the Area
Average Home Value in this Area
Purchase History
| Date | Buyer | Sale Price | Title Company |
|---|---|---|---|
| Maldonado Ricardo | $90,000 | None Listed On Document | |
| First Midwest Bank | -- | None Available | |
| Castillo Pamela J | $61,500 | -- | |
| Strock Rose | -- | -- |
Source: Public Records
Mortgage History
| Date | Status | Borrower | Loan Amount |
|---|---|---|---|
| Open | Maldonado Ricardo | $85,500 | |
| Previous Owner | Castillo Pamela J | $57,950 |
Source: Public Records
Tax History Compared to Growth
Tax History
| Year | Tax Paid | Tax Assessment Tax Assessment Total Assessment is a certain percentage of the fair market value that is determined by local assessors to be the total taxable value of land and additions on the property. | Land | Improvement |
|---|---|---|---|---|
| 2024 | $3,174 | $9,878 | $701 | $9,177 |
| 2023 | $1,075 | $9,878 | $701 | $9,177 |
| 2022 | $1,075 | $8,886 | $725 | $8,161 |
| 2021 | $1,109 | $8,884 | $724 | $8,160 |
| 2020 | $1,254 | $8,884 | $724 | $8,160 |
| 2019 | $0 | $5,495 | $654 | $4,841 |
| 2018 | $0 | $5,495 | $654 | $4,841 |
| 2017 | $0 | $5,495 | $654 | $4,841 |
| 2016 | $540 | $3,877 | $537 | $3,340 |
| 2015 | $483 | $3,877 | $537 | $3,340 |
| 2014 | $723 | $4,471 | $537 | $3,934 |
| 2013 | $1,775 | $7,804 | $537 | $7,267 |
Source: Public Records
Map
Nearby Homes
- 10109 S Cicero Ave Unit 206
- 9904 S Cicero Ave
- 9909 Elm Circle Dr
- 10336 S Keating Ave Unit 102
- 9821 S Cicero Ave Unit 8
- 10403 S Keating Ave Unit 1C
- 4433 W 100th St
- 5125 W 101st St
- 10010 Harnew Rd W Unit 1
- 5120 W 101st St
- 10016 Harnew Rd W
- 10036 S Kolin Ave
- 10008 S Kolin Ave
- 4913 W 105th St
- 4325 W 99th Place
- 10021 Cook Ave
- 4320 W 99th Place
- 5168 W 99th St
- 5009 W 105th St
- 4509 W 105th St
- 10117 S Cicero Ave Unit 302
- 10117 S Cicero Ave Unit 206
- 10117 S Cicero Ave Unit 305
- 10117 S Cicero Ave Unit 101172
- 10117 S Cicero Ave Unit 10117G
- 10117 S Cicero Ave Unit 101172
- 10117 S Cicero Ave Unit 101173
- 10117 S Cicero Ave Unit 101173
- 10117 S Cicero Ave Unit 10117G
- 10117 S Cicero Ave Unit 10117G
- 10117 S Cicero Ave Unit 10117G
- 10117 S Cicero Ave Unit 10117G
- 10117 S Cicero Ave Unit 10117G
- 10117 S Cicero Ave Unit 10117G
- 10117 S Cicero Ave Unit 10117G
- 10117 S Cicero Ave Unit 10117G
- 10117 S Cicero Ave Unit 10117G
- 10117 S Cicero Ave Unit 101173
- 10117 S Cicero Ave Unit 101172
- 10117 S Cicero Ave Unit 101172