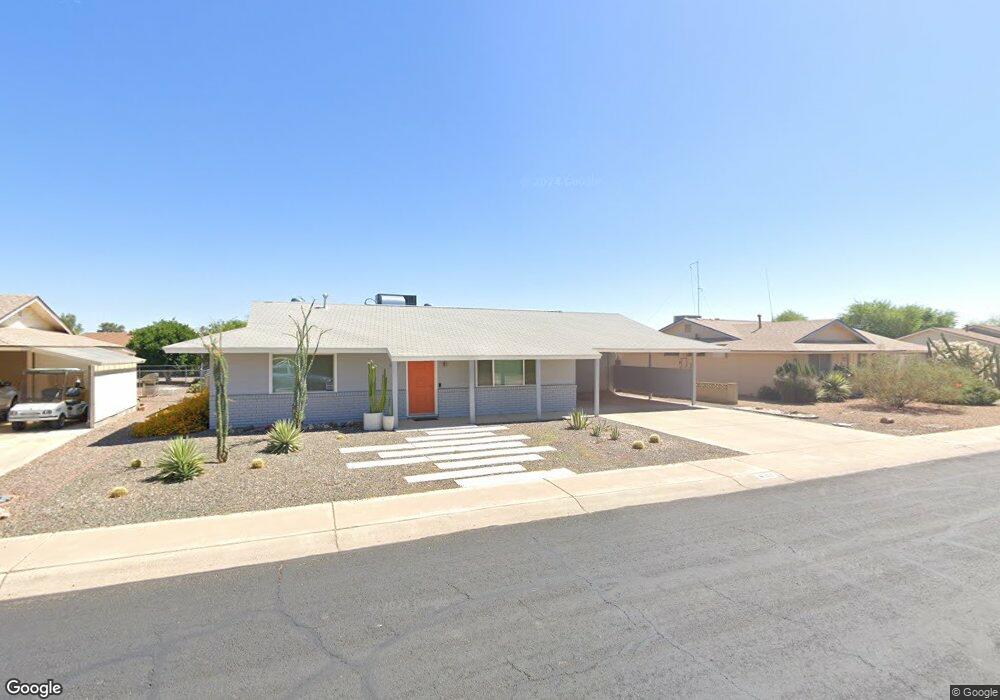
10117 W Andover Ave Unit 6 Sun City, AZ 85351
Estimated Value: $202,433 - $255,000
--
Bed
1
Bath
984
Sq Ft
$236/Sq Ft
Est. Value
About This Home
This home is located at 10117 W Andover Ave Unit 6, Sun City, AZ 85351 and is currently estimated at $231,858, approximately $235 per square foot. 10117 W Andover Ave Unit 6 is a home located in Maricopa County with nearby schools including Ombudsman - Northwest Charter and Peoria Accelerated High School.
Ownership History
Date
Name
Owned For
Owner Type
Purchase Details
Closed on
Mar 12, 2021
Sold by
Greene Richard R and Deco Kerry Ellen
Bought by
Deco Kerry Ellen
Current Estimated Value
Purchase Details
Closed on
Aug 15, 2016
Sold by
Greene Ann Marie
Bought by
Greene Richard R
Purchase Details
Closed on
Aug 8, 2011
Sold by
Main Patricia
Bought by
Hurd Lawrence
Home Financials for this Owner
Home Financials are based on the most recent Mortgage that was taken out on this home.
Original Mortgage
$17,500
Interest Rate
4.53%
Mortgage Type
Seller Take Back
Purchase Details
Closed on
Jun 2, 2011
Sold by
Sade Debra
Bought by
Hurd Lawrence and Main Patricia
Purchase Details
Closed on
Sep 19, 2008
Sold by
Jones Alissa Lynn
Bought by
Jones Alissa Lynn and The Alissa Lynn Jones Family Living Trus
Create a Home Valuation Report for This Property
The Home Valuation Report is an in-depth analysis detailing your home's value as well as a comparison with similar homes in the area
Home Values in the Area
Average Home Value in this Area
Purchase History
| Date | Buyer | Sale Price | Title Company |
|---|---|---|---|
| Deco Kerry Ellen | -- | None Available | |
| Greene Richard R | -- | Landmark Title Assurance Age | |
| Greene Richard R | $92,000 | Landmark Title Assurance Age | |
| Hurd Lawrence | $21,500 | Great American Title | |
| Hurd Lawrence | -- | None Available | |
| Jones Alissa Lynn | -- | None Available |
Source: Public Records
Mortgage History
| Date | Status | Borrower | Loan Amount |
|---|---|---|---|
| Previous Owner | Hurd Lawrence | $17,500 |
Source: Public Records
Tax History Compared to Growth
Tax History
| Year | Tax Paid | Tax Assessment Tax Assessment Total Assessment is a certain percentage of the fair market value that is determined by local assessors to be the total taxable value of land and additions on the property. | Land | Improvement |
|---|---|---|---|---|
| 2025 | $759 | $8,518 | -- | -- |
| 2024 | $685 | $8,112 | -- | -- |
| 2023 | $685 | $16,800 | $3,360 | $13,440 |
| 2022 | $643 | $13,030 | $2,600 | $10,430 |
| 2021 | $658 | $11,970 | $2,390 | $9,580 |
| 2020 | $642 | $10,420 | $2,080 | $8,340 |
| 2019 | $637 | $9,360 | $1,870 | $7,490 |
| 2018 | $617 | $8,220 | $1,640 | $6,580 |
| 2017 | $599 | $7,150 | $1,430 | $5,720 |
| 2016 | $561 | $6,610 | $1,320 | $5,290 |
| 2015 | $533 | $5,920 | $1,180 | $4,740 |
Source: Public Records
Map
Nearby Homes
- 10034 W Concord Ave
- 10131 W Cheryl Dr Unit 6D
- 10166 W Cinnebar Ave
- 10240 W Concord Ave
- 10302 W Cheryl Dr Unit D
- 10027 W Tarrytown Ave Unit 6
- 9939 W Ironwood Dr Unit 6D
- 10102 W Deanne Dr Unit 6
- 10341 W Clair Dr
- 10010 W Deanne Dr
- 10002 W Deanne Dr
- 9891 N Balboa Dr
- 9834 N Balboa Dr
- 10022 W Mountain View Rd
- 10405 W Andover Ave
- 10314 W Deanne Dr
- 10316 W Salem Dr Unit 6D
- 10076 W Peoria Ave
- 10318 W Corte Del Sol Este Unit 21
- 10425 N Balboa Dr
- 10111 W Andover Ave
- 10123 W Andover Ave
- 10116 W Cumberland Dr
- 10110 W Cumberland Dr Unit 6
- 10120 W Cumberland Dr
- 10101 W Andover Ave Unit 6
- 10116 W Andover Ave
- 10129 W Andover Ave
- 10122 W Andover Ave
- 10102 W Cumberland Dr
- 10110 W Andover Ave
- 10126 W Cumberland Dr
- 10128 W Andover Ave
- 10102 W Andover Ave
- 10135 W Andover Ave
- 10115 W Concord Ave
- 10117 W Cumberland Dr
- 10121 W Concord Ave
- 10111 W Cumberland Dr
- 10134 W Andover Ave