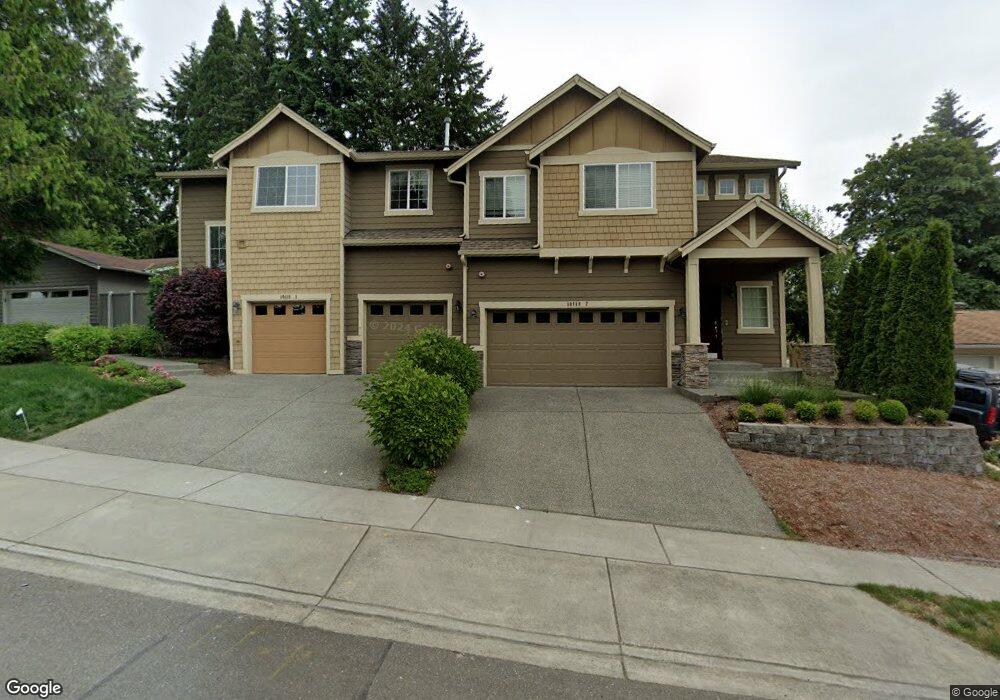
10118 162nd Ave NE Unit B Redmond, WA 98052
Education Hill NeighborhoodEstimated Value: $1,098,000 - $1,209,655
3
Beds
3
Baths
1,958
Sq Ft
$583/Sq Ft
Est. Value
About This Home
This home is located at 10118 162nd Ave NE Unit B, Redmond, WA 98052 and is currently estimated at $1,140,664, approximately $582 per square foot. 10118 162nd Ave NE Unit B is a home located in King County with nearby schools including Rockwell Elementary, Redmond Middle School, and Redmond High School.
Ownership History
Date
Name
Owned For
Owner Type
Purchase Details
Closed on
Oct 26, 2009
Sold by
Puget Homes Corporation
Bought by
Tiu Vincent and Tiu Margie D
Current Estimated Value
Home Financials for this Owner
Home Financials are based on the most recent Mortgage that was taken out on this home.
Original Mortgage
$412,200
Outstanding Balance
$269,150
Interest Rate
5%
Estimated Equity
$871,514
Purchase Details
Closed on
Jun 3, 2008
Sold by
Laxdall Daniel A
Bought by
Puget Homes Corp
Home Financials for this Owner
Home Financials are based on the most recent Mortgage that was taken out on this home.
Original Mortgage
$832,000
Interest Rate
6%
Purchase Details
Closed on
Jan 9, 1995
Sold by
Hinds James R and Hinds Dorothy
Bought by
Laxdall Daniel A
Home Financials for this Owner
Home Financials are based on the most recent Mortgage that was taken out on this home.
Original Mortgage
$100,000
Interest Rate
8.5%
Create a Home Valuation Report for This Property
The Home Valuation Report is an in-depth analysis detailing your home's value as well as a comparison with similar homes in the area
Home Values in the Area
Average Home Value in this Area
Purchase History
| Date | Buyer | Sale Price | Title Company |
|---|---|---|---|
| Tiu Vincent | $458,000 | Chicago Title | |
| Puget Homes Corp | $385,000 | Chicago Title | |
| Laxdall Daniel A | $130,950 | Transamerica Title Ins Co |
Source: Public Records
Mortgage History
| Date | Status | Borrower | Loan Amount |
|---|---|---|---|
| Open | Tiu Vincent | $412,200 | |
| Previous Owner | Puget Homes Corp | $832,000 | |
| Previous Owner | Laxdall Daniel A | $100,000 |
Source: Public Records
Tax History Compared to Growth
Tax History
| Year | Tax Paid | Tax Assessment Tax Assessment Total Assessment is a certain percentage of the fair market value that is determined by local assessors to be the total taxable value of land and additions on the property. | Land | Improvement |
|---|---|---|---|---|
| 2024 | $9,050 | $1,151,000 | $187,500 | $963,500 |
| 2023 | $9,310 | $1,125,000 | $187,500 | $937,500 |
| 2022 | $6,877 | $972,000 | $184,500 | $787,500 |
| 2021 | $6,677 | $799,000 | $184,500 | $614,500 |
| 2020 | $7,149 | $717,000 | $184,500 | $532,500 |
| 2018 | $5,797 | $765,000 | $154,500 | $610,500 |
| 2017 | $5,535 | $580,000 | $140,000 | $440,000 |
| 2016 | $4,786 | $578,000 | $125,000 | $453,000 |
| 2015 | $4,958 | $495,000 | $125,000 | $370,000 |
| 2014 | -- | $495,000 | $99,500 | $395,500 |
| 2013 | -- | $387,000 | $99,500 | $287,500 |
Source: Public Records
Map
Nearby Homes
- 10417 165th Place NE
- 16704 NE 102nd Place
- 16709 NE 102nd Place
- 10176 156th Ct NE Unit 102
- 9484 Redmond-Woodinville Rd NE Unit C-305
- 9484 Redmond-Woodinville Rd NE Unit C-205
- 10390 156th Place NE Unit 102
- 16704 NE 97th St
- 15415 NE 103rd Way
- 15939 NE 95th Way Unit 12
- 16725 NE 97th St
- 16900 NE 98th Ct
- 15419 NE 106th St
- 15542 NE 106th Way
- 16915 NE 98th Ct
- 16825 NE 106th St
- 16422 NE 91st St Unit 104
- 10925 165th Place NE
- 9310 167th Ave NE
- 9408 168th Place NE
- 10118 162nd Ave NE Unit 1
- 10118 162nd Ave NE Unit 2
- 10118 162nd Ave NE
- 10118 162nd Ave NE Unit A
- 0 162nd Ave NE Unit A 25815
- 10110 162nd Ave NE
- 10126 162nd Ave NE
- 10109 162nd Place NE
- 10115 162nd Place NE
- 10102 162nd Ave NE
- 10204 162nd Ave NE
- 10117 162nd Ave NE
- 10125 162nd Ave NE
- 10201 162nd Ave NE
- 10109 162nd Ave NE
- 10119 162nd Place NE
- 10205 162nd Ave NE
- 10212 162nd Ave NE
- 10012 162nd Ave NE
- 10101 162nd Ave NE