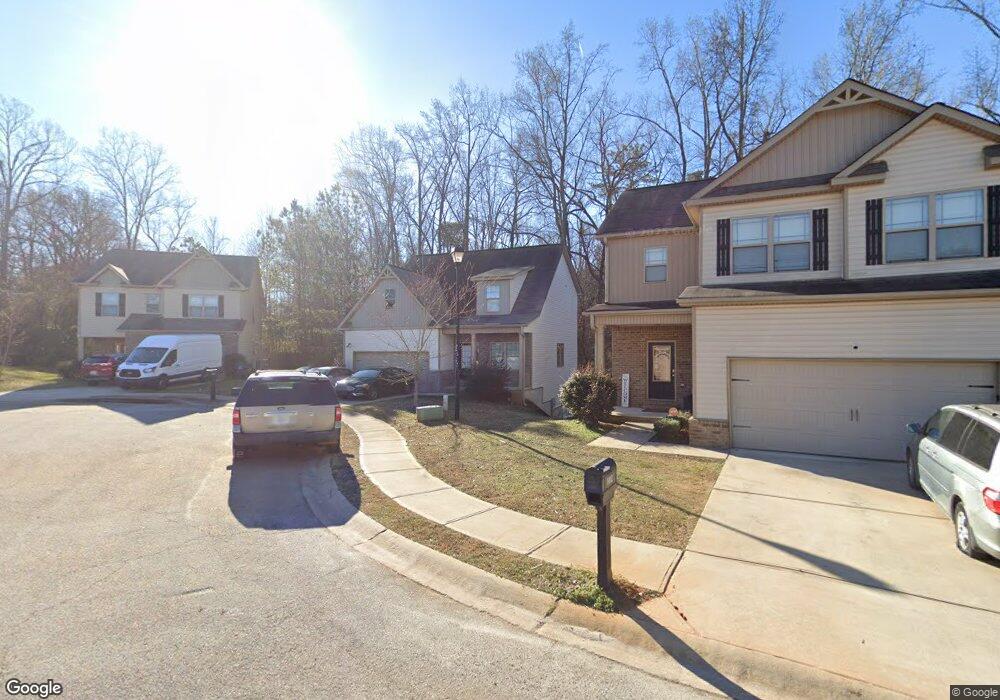
1012 Allegiance Dr Locust Grove, GA 30248
Estimated Value: $276,000 - $302,000
4
Beds
3
Baths
1,885
Sq Ft
$153/Sq Ft
Est. Value
About This Home
This home is located at 1012 Allegiance Dr, Locust Grove, GA 30248 and is currently estimated at $287,478, approximately $152 per square foot. 1012 Allegiance Dr is a home with nearby schools including Locust Grove Elementary School, Locust Grove Middle School, and Locust Grove High School.
Ownership History
Date
Name
Owned For
Owner Type
Purchase Details
Closed on
Jun 23, 2022
Sold by
Sfr Investments V Borrower 1 Llc
Bought by
Progress Residential Borrower 20 Llc
Current Estimated Value
Purchase Details
Closed on
Jun 23, 2021
Sold by
Atl 3 Sf Llc
Bought by
Sfr Investments V Borrower 1 Llc
Purchase Details
Closed on
Sep 14, 2018
Sold by
Horizon Holdings Georgia Llc
Bought by
Atl 3 Sf Llc
Purchase Details
Closed on
Dec 6, 2017
Sold by
Paramount Community Builde
Bought by
Horizon Holdings Georgia Llc
Purchase Details
Closed on
May 1, 2015
Sold by
Patriots Point Investors Llc
Bought by
Paramount Community Builders L
Purchase Details
Closed on
Mar 7, 2013
Sold by
Paramount Community Builde
Bought by
Patriots Point Investors Llc
Create a Home Valuation Report for This Property
The Home Valuation Report is an in-depth analysis detailing your home's value as well as a comparison with similar homes in the area
Home Values in the Area
Average Home Value in this Area
Purchase History
| Date | Buyer | Sale Price | Title Company |
|---|---|---|---|
| Progress Residential Borrower 20 Llc | -- | -- | |
| Sfr Investments V Borrower 1 Llc | $10,068,212 | -- | |
| Atl 3 Sf Llc | $644,200 | -- | |
| Horizon Holdings Georgia Llc | $30,000 | -- | |
| Paramount Community Builders L | $300,000 | -- | |
| Patriots Point Investors Llc | $340,000 | -- | |
| Paramount Community Builders L | $340,000 | -- | |
| Hamilton State Bank | -- | -- |
Source: Public Records
Tax History Compared to Growth
Tax History
| Year | Tax Paid | Tax Assessment Tax Assessment Total Assessment is a certain percentage of the fair market value that is determined by local assessors to be the total taxable value of land and additions on the property. | Land | Improvement |
|---|---|---|---|---|
| 2025 | $4,810 | $123,560 | $15,542 | $108,018 |
| 2024 | $4,810 | $125,880 | $16,000 | $109,880 |
| 2023 | $4,786 | $132,240 | $14,000 | $118,240 |
| 2022 | $2,752 | $75,080 | $10,000 | $65,080 |
| 2021 | $2,757 | $75,080 | $10,000 | $65,080 |
| 2020 | $2,757 | $75,080 | $10,000 | $65,080 |
| 2019 | $2,409 | $64,420 | $10,000 | $54,420 |
| 2018 | $0 | $2,400 | $2,400 | $0 |
| 2016 | $283 | $7,760 | $7,760 | $0 |
| 2015 | $302 | $8,000 | $8,000 | $0 |
| 2014 | -- | $1,440 | $1,440 | $0 |
Source: Public Records
Map
Nearby Homes
- 1014 Allegiance Dr
- 1008 Allegiance Dr
- 1016 Allegiance Dr
- 1018 Allegiance Dr
- 216 Siesta Key Ct
- 1006 Allegiance Dr
- 1015 Allegiance Dr
- 1018 Allegiance Dr
- 1009 Allegiance Dr
- 1020 Allegiance Dr
- 1005 Allegiance Dr
- 1004 Allegiance Dr
- 212 Siesta Key Ct
- 1022 Allegiance Dr
- 1023 Allegiance Dr
- 1024 Allegiance Dr
- 1002 Allegiance Dr
- 51 Woodland Dr
- 208 Siesta Key Ct Unit 51
- 208 Siesta Key Ct