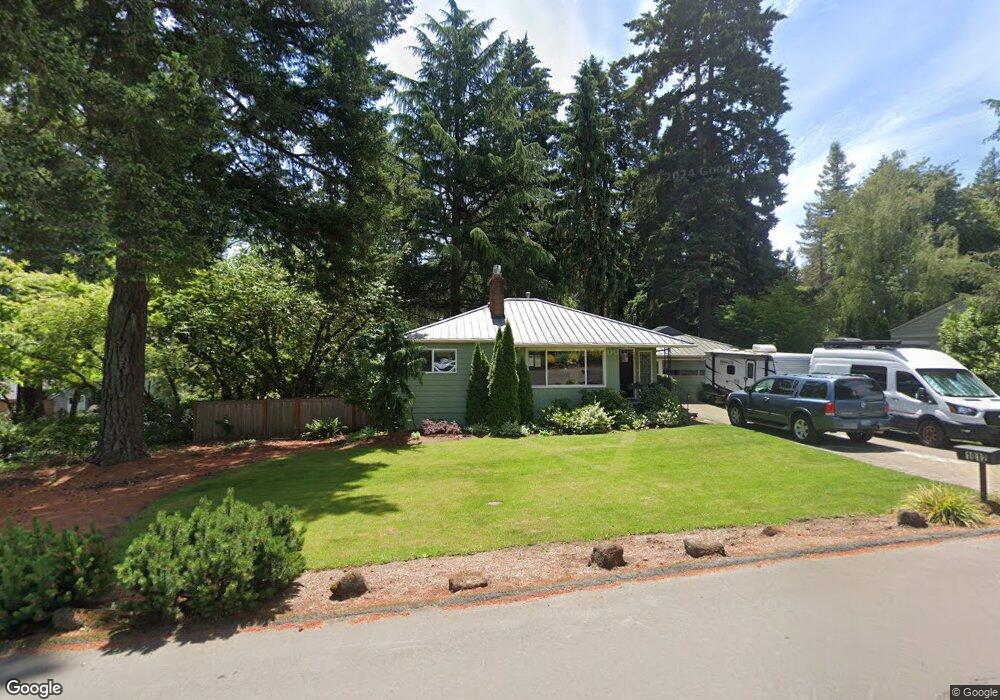
1012 Andrews Rd Lake Oswego, OR 97034
Evergreen NeighborhoodEstimated Value: $1,101,106 - $1,242,000
3
Beds
2
Baths
2,143
Sq Ft
$550/Sq Ft
Est. Value
About This Home
This home is located at 1012 Andrews Rd, Lake Oswego, OR 97034 and is currently estimated at $1,179,277, approximately $550 per square foot. 1012 Andrews Rd is a home located in Clackamas County with nearby schools including Forest Hills Elementary School, Lake Oswego Junior High School, and Lake Oswego Senior High School.
Ownership History
Date
Name
Owned For
Owner Type
Purchase Details
Closed on
Jul 9, 2014
Sold by
Piccard Paul L
Bought by
Alt Erin C
Current Estimated Value
Home Financials for this Owner
Home Financials are based on the most recent Mortgage that was taken out on this home.
Original Mortgage
$27,900
Outstanding Balance
$21,189
Interest Rate
4.16%
Mortgage Type
Credit Line Revolving
Estimated Equity
$1,158,088
Purchase Details
Closed on
Aug 12, 2008
Sold by
Burke John C and Burke Erin L
Bought by
Piccard Paul L
Home Financials for this Owner
Home Financials are based on the most recent Mortgage that was taken out on this home.
Original Mortgage
$396,000
Interest Rate
6.09%
Mortgage Type
Purchase Money Mortgage
Purchase Details
Closed on
Jun 25, 2002
Sold by
Hardiman David W
Bought by
Burke John C and Burke Erin L
Home Financials for this Owner
Home Financials are based on the most recent Mortgage that was taken out on this home.
Original Mortgage
$222,300
Interest Rate
6.86%
Create a Home Valuation Report for This Property
The Home Valuation Report is an in-depth analysis detailing your home's value as well as a comparison with similar homes in the area
Home Values in the Area
Average Home Value in this Area
Purchase History
| Date | Buyer | Sale Price | Title Company |
|---|---|---|---|
| Alt Erin C | $510,000 | First American | |
| Piccard Paul L | $495,000 | Pacific Nw Title | |
| Burke John C | $247,000 | Pacific Nw Title |
Source: Public Records
Mortgage History
| Date | Status | Borrower | Loan Amount |
|---|---|---|---|
| Open | Alt Erin C | $27,900 | |
| Open | Alt Erin C | $405,600 | |
| Previous Owner | Piccard Paul L | $396,000 | |
| Previous Owner | Burke John C | $222,300 |
Source: Public Records
Tax History Compared to Growth
Tax History
| Year | Tax Paid | Tax Assessment Tax Assessment Total Assessment is a certain percentage of the fair market value that is determined by local assessors to be the total taxable value of land and additions on the property. | Land | Improvement |
|---|---|---|---|---|
| 2025 | $6,723 | $350,851 | -- | -- |
| 2024 | $6,544 | $340,633 | -- | -- |
| 2023 | $6,544 | $330,712 | $0 | $0 |
| 2022 | $6,163 | $321,080 | $0 | $0 |
| 2021 | $5,692 | $311,729 | $0 | $0 |
| 2020 | $5,549 | $302,650 | $0 | $0 |
| 2019 | $5,412 | $293,835 | $0 | $0 |
| 2018 | $5,147 | $285,277 | $0 | $0 |
| 2017 | $4,966 | $276,968 | $0 | $0 |
| 2016 | $4,520 | $268,901 | $0 | $0 |
| 2015 | $4,367 | $261,069 | $0 | $0 |
| 2014 | $4,311 | $253,465 | $0 | $0 |
Source: Public Records
Map
Nearby Homes