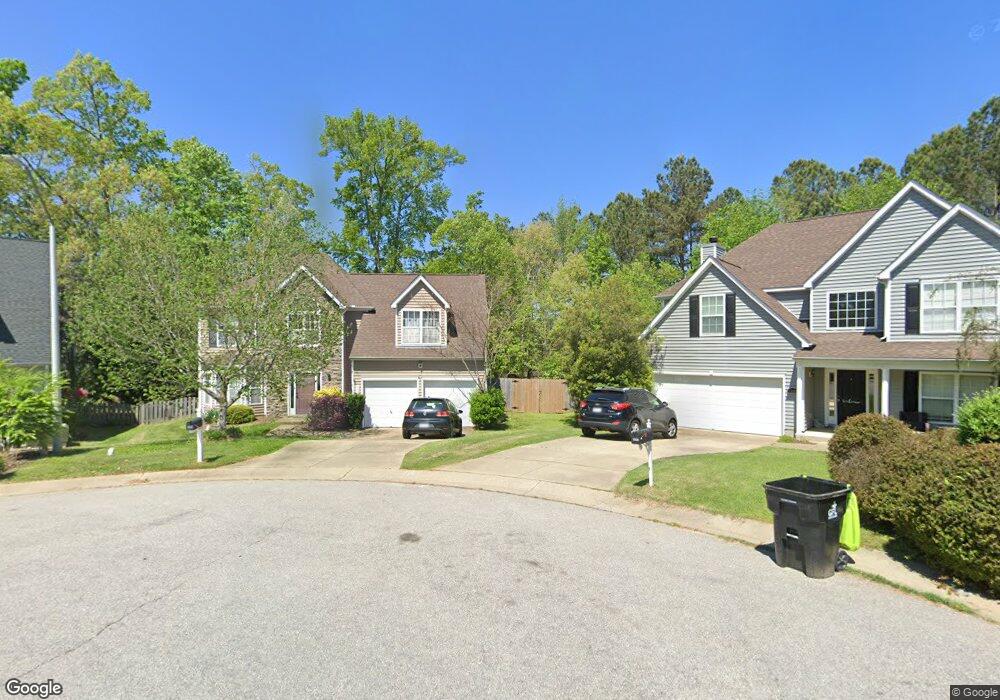
1012 Avent Meadows Ln Holly Springs, NC 27540
Estimated Value: $473,000 - $487,040
3
Beds
3
Baths
2,632
Sq Ft
$182/Sq Ft
Est. Value
About This Home
This home is located at 1012 Avent Meadows Ln, Holly Springs, NC 27540 and is currently estimated at $478,510, approximately $181 per square foot. 1012 Avent Meadows Ln is a home located in Wake County with nearby schools including Holly Grove Elementary School, Holly Grove Middle School, and Holly Springs High School.
Ownership History
Date
Name
Owned For
Owner Type
Purchase Details
Closed on
Oct 23, 2015
Sold by
Mcnamara Scott D and Mcnamara Renee A
Bought by
Meador Christopher J and Meador Sara A
Current Estimated Value
Home Financials for this Owner
Home Financials are based on the most recent Mortgage that was taken out on this home.
Original Mortgage
$237,405
Outstanding Balance
$187,168
Interest Rate
3.94%
Mortgage Type
New Conventional
Estimated Equity
$291,342
Purchase Details
Closed on
Oct 14, 2005
Sold by
Homelife Communities Of Raleigh Inc
Bought by
Mcnamara Scott D and Mcnamara Renee A
Home Financials for this Owner
Home Financials are based on the most recent Mortgage that was taken out on this home.
Original Mortgage
$143,190
Interest Rate
5.66%
Mortgage Type
Fannie Mae Freddie Mac
Create a Home Valuation Report for This Property
The Home Valuation Report is an in-depth analysis detailing your home's value as well as a comparison with similar homes in the area
Home Values in the Area
Average Home Value in this Area
Purchase History
| Date | Buyer | Sale Price | Title Company |
|---|---|---|---|
| Meador Christopher J | $250,000 | Attorney | |
| Mcnamara Scott D | $203,500 | None Available |
Source: Public Records
Mortgage History
| Date | Status | Borrower | Loan Amount |
|---|---|---|---|
| Open | Meador Christopher J | $237,405 | |
| Previous Owner | Mcnamara Scott D | $143,190 |
Source: Public Records
Tax History Compared to Growth
Tax History
| Year | Tax Paid | Tax Assessment Tax Assessment Total Assessment is a certain percentage of the fair market value that is determined by local assessors to be the total taxable value of land and additions on the property. | Land | Improvement |
|---|---|---|---|---|
| 2025 | $3,988 | $461,104 | $110,000 | $351,104 |
| 2024 | $3,972 | $461,104 | $110,000 | $351,104 |
| 2023 | $3,312 | $305,859 | $55,000 | $250,859 |
| 2022 | $3,198 | $305,220 | $55,000 | $250,220 |
| 2021 | $3,138 | $305,220 | $55,000 | $250,220 |
| 2020 | $3,138 | $305,220 | $55,000 | $250,220 |
| 2019 | $2,904 | $239,670 | $48,000 | $191,670 |
| 2018 | $2,625 | $239,670 | $48,000 | $191,670 |
| 2017 | $2,531 | $239,670 | $48,000 | $191,670 |
| 2016 | $2,496 | $239,670 | $48,000 | $191,670 |
| 2015 | $2,393 | $226,137 | $42,000 | $184,137 |
| 2014 | $2,311 | $226,137 | $42,000 | $184,137 |
Source: Public Records
Map
Nearby Homes
- 505 Pyracantha Dr
- 113 Braxman Ln
- 213 Holly Moor Ln
- 304 Magnolia Meadow Way
- 221 Chickasaw Plum Dr
- 233 Hickory Glen Ln
- 161 Summit Oaks Ln
- 320 Chickasaw Plum Dr
- 208 Autumn Glen Ln
- 425 Cahors Trail
- 273 Scarlet Tanager Cir
- 341 Covenant Rock Ln
- 100 Avent Pines Ln
- 104 Pointe Park Cir
- 101 Covenant Rock Ln
- 108 Pointe Park Cir
- 109 Crested Coral Dr
- 1712 Avent Ferry Rd
- 305 Tonks Trail
- 112 Tupelo Grove Ln
- 1008 Avent Meadows Ln
- 1013 Avent Meadows Ln
- 1521 Dexter Ridge Dr
- 1517 Dexter Ridge Dr
- 1513 Dexter Ridge Dr
- 1004 Avent Meadows Ln
- 1009 Avent Meadows Ln
- 1005 Avent Meadows Ln
- 1509 Dexter Ridge Dr
- 1000 Avent Meadows Ln
- 1505 Dexter Ridge Dr
- 717 Pyracantha Dr
- 1001 Avent Meadows Ln
- 721 Pyracantha Dr
- 713 Pyracantha Dr
- 1516 Dexter Ridge Dr
- 1501 Dexter Ridge Dr
- 1512 Dexter Ridge Dr
- 705 Pyracantha Dr
- 936 Avent Meadows Ln