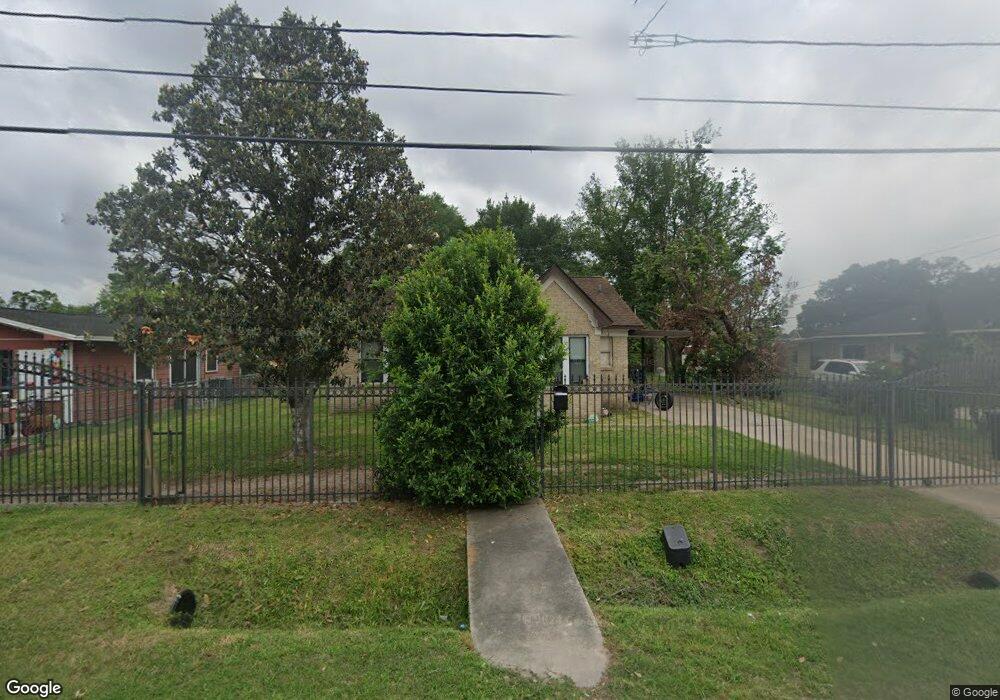
1012 Caplin St Houston, TX 77022
Northside-Northline NeighborhoodEstimated Value: $174,760 - $298,000
2
Beds
1
Bath
1,006
Sq Ft
$255/Sq Ft
Est. Value
About This Home
This home is located at 1012 Caplin St, Houston, TX 77022 and is currently estimated at $256,440, approximately $254 per square foot. 1012 Caplin St is a home located in Harris County with nearby schools including Roosevelt Elementary School, Burbank Middle School, and Northside High School.
Ownership History
Date
Name
Owned For
Owner Type
Purchase Details
Closed on
Aug 12, 2011
Sold by
Fannie Mae
Bought by
Cayon Oscar
Current Estimated Value
Purchase Details
Closed on
Mar 1, 2011
Sold by
Galvan Isaias
Bought by
Federal National Mortgage Association
Purchase Details
Closed on
Oct 26, 2004
Sold by
Garcia Alfonso and Garcia Elsa
Bought by
Galvan Isaias
Home Financials for this Owner
Home Financials are based on the most recent Mortgage that was taken out on this home.
Original Mortgage
$87,977
Interest Rate
5.71%
Mortgage Type
Purchase Money Mortgage
Purchase Details
Closed on
Feb 2, 1996
Sold by
Alcala Beatrice
Bought by
Garcia Alfonso A
Home Financials for this Owner
Home Financials are based on the most recent Mortgage that was taken out on this home.
Original Mortgage
$40,850
Interest Rate
7.19%
Create a Home Valuation Report for This Property
The Home Valuation Report is an in-depth analysis detailing your home's value as well as a comparison with similar homes in the area
Home Values in the Area
Average Home Value in this Area
Purchase History
| Date | Buyer | Sale Price | Title Company |
|---|---|---|---|
| Cayon Oscar | -- | Old Republic National Title | |
| Federal National Mortgage Association | $78,952 | None Available | |
| Galvan Isaias | -- | Fidelity National Title | |
| Garcia Alfonso A | -- | Stewart Title |
Source: Public Records
Mortgage History
| Date | Status | Borrower | Loan Amount |
|---|---|---|---|
| Previous Owner | Galvan Isaias | $87,977 | |
| Previous Owner | Garcia Alfonso A | $40,850 |
Source: Public Records
Tax History Compared to Growth
Tax History
| Year | Tax Paid | Tax Assessment Tax Assessment Total Assessment is a certain percentage of the fair market value that is determined by local assessors to be the total taxable value of land and additions on the property. | Land | Improvement |
|---|---|---|---|---|
| 2025 | $3,138 | $197,093 | $141,750 | $55,343 |
| 2024 | $3,138 | $149,996 | $70,875 | $79,121 |
| 2023 | $3,138 | $165,383 | $70,875 | $94,508 |
| 2022 | $3,654 | $165,938 | $70,875 | $95,063 |
| 2021 | $3,272 | $140,406 | $70,875 | $69,531 |
| 2020 | $3,400 | $140,406 | $70,875 | $69,531 |
| 2019 | $3,553 | $140,406 | $70,875 | $69,531 |
| 2018 | $3,040 | $120,122 | $70,875 | $49,247 |
| 2017 | $3,037 | $120,122 | $70,875 | $49,247 |
| 2016 | $3,037 | $120,122 | $70,875 | $49,247 |
| 2015 | $1,950 | $88,533 | $37,209 | $51,324 |
| 2014 | $1,950 | $75,855 | $37,209 | $38,646 |
Source: Public Records
Map
Nearby Homes