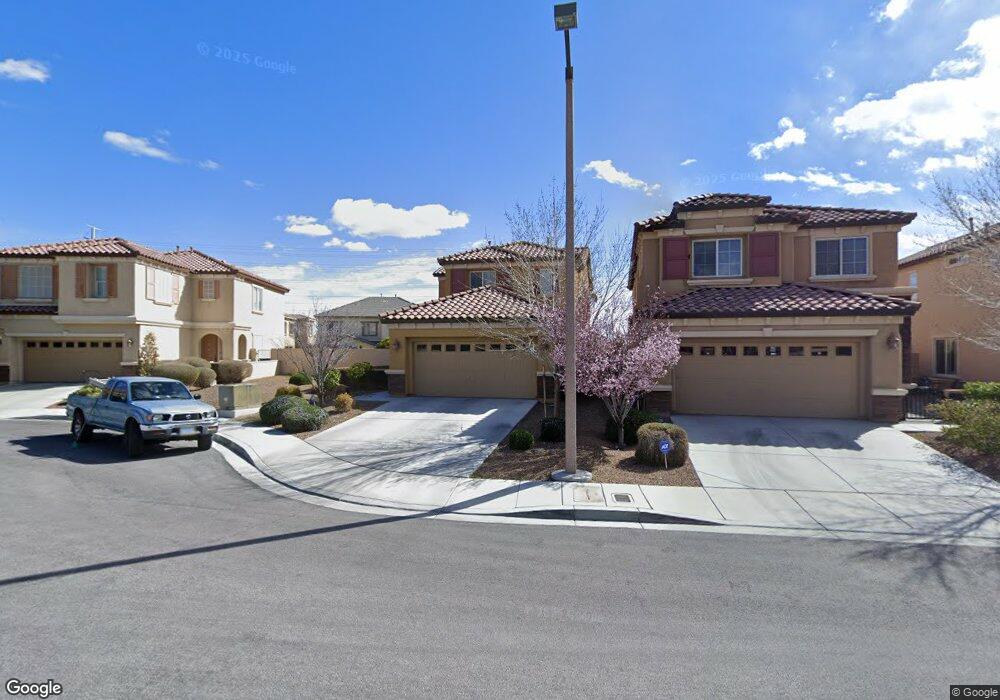
1012 Chestnut Chase St Las Vegas, NV 89138
Estimated Value: $620,954 - $667,000
3
Beds
4
Baths
1,990
Sq Ft
$325/Sq Ft
Est. Value
About This Home
This home is located at 1012 Chestnut Chase St, Las Vegas, NV 89138 and is currently estimated at $646,239, approximately $324 per square foot. 1012 Chestnut Chase St is a home located in Clark County with nearby schools including Linda Rankin Givens Elementary School, Sig Rogich Middle School, and Palo Verde High School.
Ownership History
Date
Name
Owned For
Owner Type
Purchase Details
Closed on
Jan 8, 2019
Sold by
Schmit Jessica Gisela
Bought by
Schmit Kenneth V
Current Estimated Value
Purchase Details
Closed on
Nov 23, 2010
Sold by
Fein Rita
Bought by
Schmit Kenneth
Home Financials for this Owner
Home Financials are based on the most recent Mortgage that was taken out on this home.
Original Mortgage
$230,992
Outstanding Balance
$153,180
Interest Rate
4.37%
Mortgage Type
FHA
Estimated Equity
$493,059
Purchase Details
Closed on
Dec 10, 2008
Sold by
Ryland Homes Nevada Llc
Bought by
Fein Rita
Home Financials for this Owner
Home Financials are based on the most recent Mortgage that was taken out on this home.
Original Mortgage
$287,991
Interest Rate
6.47%
Mortgage Type
Unknown
Create a Home Valuation Report for This Property
The Home Valuation Report is an in-depth analysis detailing your home's value as well as a comparison with similar homes in the area
Home Values in the Area
Average Home Value in this Area
Purchase History
| Date | Buyer | Sale Price | Title Company |
|---|---|---|---|
| Schmit Kenneth V | -- | Vantage Point Title Inc | |
| Schmit Kenneth | $237,000 | Fidelity National Title Las | |
| Fein Rita | $319,990 | Cornerstone Title Company Db |
Source: Public Records
Mortgage History
| Date | Status | Borrower | Loan Amount |
|---|---|---|---|
| Open | Schmit Kenneth | $230,992 | |
| Previous Owner | Fein Rita | $287,991 | |
| Closed | Schmit Kenneth V | $0 |
Source: Public Records
Tax History Compared to Growth
Tax History
| Year | Tax Paid | Tax Assessment Tax Assessment Total Assessment is a certain percentage of the fair market value that is determined by local assessors to be the total taxable value of land and additions on the property. | Land | Improvement |
|---|---|---|---|---|
| 2025 | $3,673 | $177,405 | $68,250 | $109,155 |
| 2024 | $3,567 | $177,405 | $68,250 | $109,155 |
| 2023 | $3,567 | $151,702 | $49,000 | $102,702 |
| 2022 | $3,463 | $134,487 | $40,950 | $93,537 |
| 2021 | $3,361 | $127,702 | $38,850 | $88,852 |
| 2020 | $3,260 | $125,005 | $37,100 | $87,905 |
| 2019 | $3,219 | $120,132 | $33,950 | $86,182 |
| 2018 | $3,069 | $110,529 | $28,000 | $82,529 |
| 2017 | $3,650 | $111,166 | $28,000 | $83,166 |
| 2016 | $2,872 | $103,147 | $19,600 | $83,547 |
| 2015 | $2,867 | $86,395 | $18,200 | $68,195 |
| 2014 | $2,783 | $82,159 | $14,000 | $68,159 |
Source: Public Records
Map
Nearby Homes
- 11221 Stanwick Ave
- 956 Baronet Dr
- 957 Baronet Dr
- 929 Viscanio Place
- 11304 Asilo Bianco Ave
- 11329 Hedgemont Ave
- 11238 Essence Point Ave Unit 208
- 11238 Essence Point Ave Unit 205
- 11250 Hidden Peak Ave Unit 201
- 1247 Rock Hills St Unit 101
- 11250 Hidden Peak Ave Unit 305
- 11236 Rainbow Peak Ave Unit 210
- 11251 Hidden Peak Ave Unit 212
- 11297 Essence Point Ave Unit 102
- 11230 Hidden Peak Ave Unit 203
- 11238 Essence Point Ave Unit 201
- 11278 Kraft Mountain Ave Unit 101
- 11236 Rainbow Peak Ave Unit 211
- 11288 Vision Peak Ave Unit 101
- 11257 Rainbow Peak Ave Unit 211
- 1016 Chestnut Chase St
- 968 Chestnut Chase St
- 1020 Chestnut Chase St
- 1005 Hickory Park St
- 969 Hickory Park St
- 1024 Chestnut Chase St
- 1013 Hickory Park St
- 964 Chestnut Chase St
- 960 Chestnut Chase St
- 1028 Chestnut Chase St
- 1017 Chestnut Chase St
- 1021 Chestnut Chase St
- 1021 Chestnut Chase St
- 1021 Hickory Park St
- 1025 Chestnut Chase St
- 961 Hickory Park St
- 965 Chestnut Chase St
- 1013 Chestnut Chase St
- 969 Chestnut Chase St