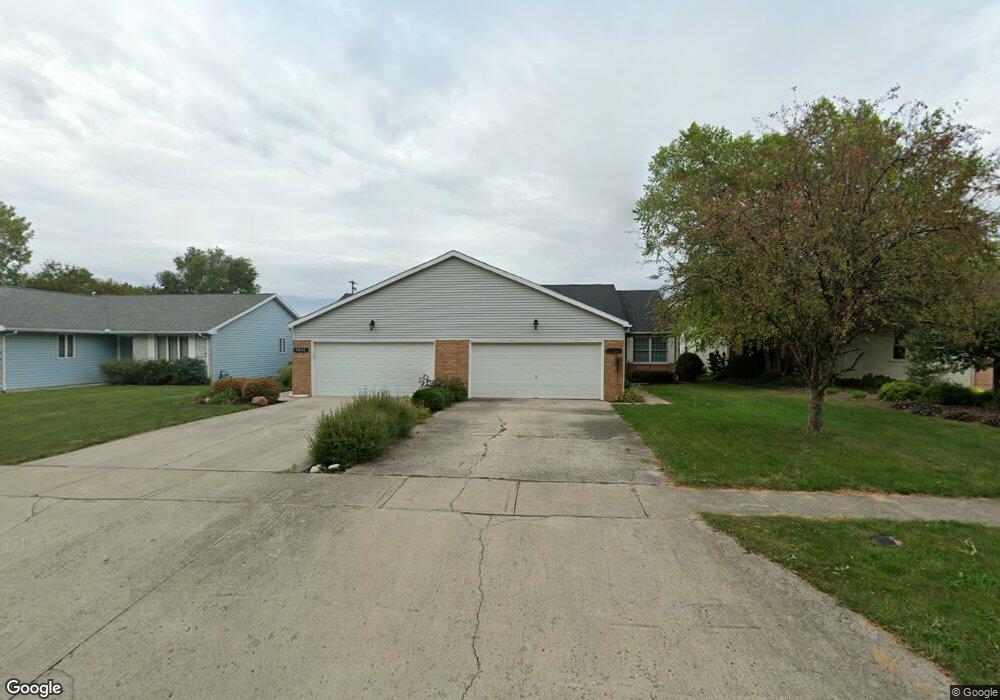
1012 Dalores Dr Findlay, OH 45840
Estimated Value: $208,000 - $241,000
2
Beds
2
Baths
1,526
Sq Ft
$150/Sq Ft
Est. Value
About This Home
This home is located at 1012 Dalores Dr, Findlay, OH 45840 and is currently estimated at $228,612, approximately $149 per square foot. 1012 Dalores Dr is a home located in Hancock County with nearby schools including Wilson Vance Elementary School, Whittier Elementary School, and Donnell Middle School.
Ownership History
Date
Name
Owned For
Owner Type
Purchase Details
Closed on
May 28, 2019
Sold by
Wagner Sandra S
Bought by
Benroth James and Benroth Imogene
Current Estimated Value
Purchase Details
Closed on
Apr 28, 1999
Sold by
Hermansen Mildred
Bought by
Wagner Sandra
Home Financials for this Owner
Home Financials are based on the most recent Mortgage that was taken out on this home.
Original Mortgage
$70,000
Interest Rate
7.05%
Mortgage Type
New Conventional
Purchase Details
Closed on
Jun 17, 1996
Sold by
George Ede Building
Bought by
Harris Richard and Harris Kelli
Purchase Details
Closed on
Jan 14, 1993
Bought by
Ede George J Bldg & Realty
Purchase Details
Closed on
Sep 23, 1992
Bought by
Nash Dale P and Nash Ruby
Purchase Details
Closed on
Oct 1, 1991
Bought by
Ede George J Bldg & Realty
Create a Home Valuation Report for This Property
The Home Valuation Report is an in-depth analysis detailing your home's value as well as a comparison with similar homes in the area
Home Values in the Area
Average Home Value in this Area
Purchase History
| Date | Buyer | Sale Price | Title Company |
|---|---|---|---|
| Benroth James | $162,000 | Flag City Title Agency Inc | |
| Wagner Sandra | $57,000 | -- | |
| Harris Richard | $98,500 | -- | |
| Ede George J Bldg & Realty | -- | -- | |
| Nash Dale P | $90,000 | -- | |
| Ede George J Bldg & Realty | -- | -- |
Source: Public Records
Mortgage History
| Date | Status | Borrower | Loan Amount |
|---|---|---|---|
| Previous Owner | Wagner Sandra | $70,000 |
Source: Public Records
Tax History Compared to Growth
Tax History
| Year | Tax Paid | Tax Assessment Tax Assessment Total Assessment is a certain percentage of the fair market value that is determined by local assessors to be the total taxable value of land and additions on the property. | Land | Improvement |
|---|---|---|---|---|
| 2024 | $1,878 | $52,880 | $2,800 | $50,080 |
| 2023 | $1,881 | $52,880 | $2,800 | $50,080 |
| 2022 | $1,875 | $52,880 | $2,800 | $50,080 |
| 2021 | $1,874 | $46,050 | $2,100 | $43,950 |
| 2020 | $1,874 | $46,050 | $2,100 | $43,950 |
| 2019 | $1,836 | $46,050 | $2,100 | $43,950 |
| 2018 | $1,828 | $42,060 | $2,100 | $39,960 |
| 2017 | $1,829 | $42,060 | $2,100 | $39,960 |
| 2016 | $1,806 | $42,060 | $2,100 | $39,960 |
| 2015 | $1,742 | $39,830 | $2,100 | $37,730 |
| 2014 | $1,742 | $39,830 | $2,100 | $37,730 |
| 2012 | $1,754 | $39,830 | $2,100 | $37,730 |
Source: Public Records
Map
Nearby Homes
- 1016 Dalores Dr Unit 1
- 1008 Dalores Dr
- 1102 Dalores Dr
- 1100 Dalores Dr
- 1004 Dalores Dr
- 1112 Dalores Dr
- 445 Avondale Rd
- 1051 Tiffin Ave Front Unit
- 1051 Tiffin Ave Back Unit
- 1000 Dalores Dr
- 1124 Dalores Dr
- 1004 Glen Rd
- 1010 Glen Rd
- 1113 Dalores Dr
- 1000 Glen Rd
- 1051 Tiffin Ave Unit B
- 1051 Tiffin Ave Unit Rear
- 1051 Tiffin Ave Unit Front Unit
- 1051 Tiffin Ave
- 1049 Tiffin Ave