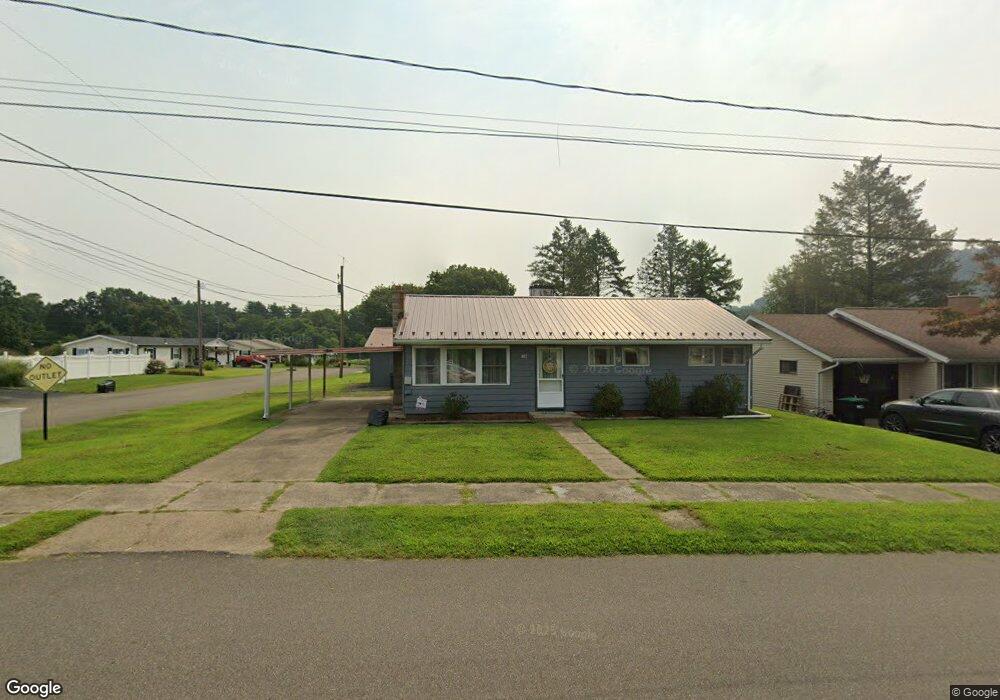
1012 E 2nd St Nescopeck, PA 18635
Estimated Value: $196,000 - $282,000
--
Bed
--
Bath
1,082
Sq Ft
$219/Sq Ft
Est. Value
About This Home
This home is located at 1012 E 2nd St, Nescopeck, PA 18635 and is currently estimated at $237,186, approximately $219 per square foot. 1012 E 2nd St is a home located in Luzerne County with nearby schools including Berwick Area High School, Holy Family Consolidated School, and New Story School.
Ownership History
Date
Name
Owned For
Owner Type
Purchase Details
Closed on
Mar 23, 2018
Sold by
Kishbaugh Kathryn I and Kishbaugh Kim E
Bought by
Dennison Richard A and Dennison Bonnie L
Current Estimated Value
Home Financials for this Owner
Home Financials are based on the most recent Mortgage that was taken out on this home.
Original Mortgage
$100,000
Outstanding Balance
$85,570
Interest Rate
4.32%
Mortgage Type
New Conventional
Estimated Equity
$151,616
Purchase Details
Closed on
Apr 27, 1992
Bought by
Horn Eugene
Create a Home Valuation Report for This Property
The Home Valuation Report is an in-depth analysis detailing your home's value as well as a comparison with similar homes in the area
Home Values in the Area
Average Home Value in this Area
Purchase History
| Date | Buyer | Sale Price | Title Company |
|---|---|---|---|
| Dennison Richard A | $139,000 | American Independent Abstrac | |
| Horn Eugene | $30,000 | -- |
Source: Public Records
Mortgage History
| Date | Status | Borrower | Loan Amount |
|---|---|---|---|
| Open | Dennison Richard A | $100,000 |
Source: Public Records
Tax History Compared to Growth
Tax History
| Year | Tax Paid | Tax Assessment Tax Assessment Total Assessment is a certain percentage of the fair market value that is determined by local assessors to be the total taxable value of land and additions on the property. | Land | Improvement |
|---|---|---|---|---|
| 2025 | $3,233 | $143,900 | $42,400 | $101,500 |
| 2024 | $3,136 | $143,900 | $42,400 | $101,500 |
| 2023 | $3,011 | $143,900 | $42,400 | $101,500 |
| 2022 | $2,984 | $143,900 | $42,400 | $101,500 |
| 2021 | $2,754 | $143,900 | $42,400 | $101,500 |
| 2020 | $2,671 | $143,900 | $42,400 | $101,500 |
| 2019 | $2,651 | $143,900 | $42,400 | $101,500 |
| 2018 | $2,633 | $143,900 | $42,400 | $101,500 |
| 2017 | $2,736 | $143,900 | $42,400 | $101,500 |
| 2016 | -- | $143,900 | $42,400 | $101,500 |
| 2015 | -- | $143,900 | $42,400 | $101,500 |
| 2014 | -- | $143,900 | $42,400 | $101,500 |
Source: Public Records
Map
Nearby Homes