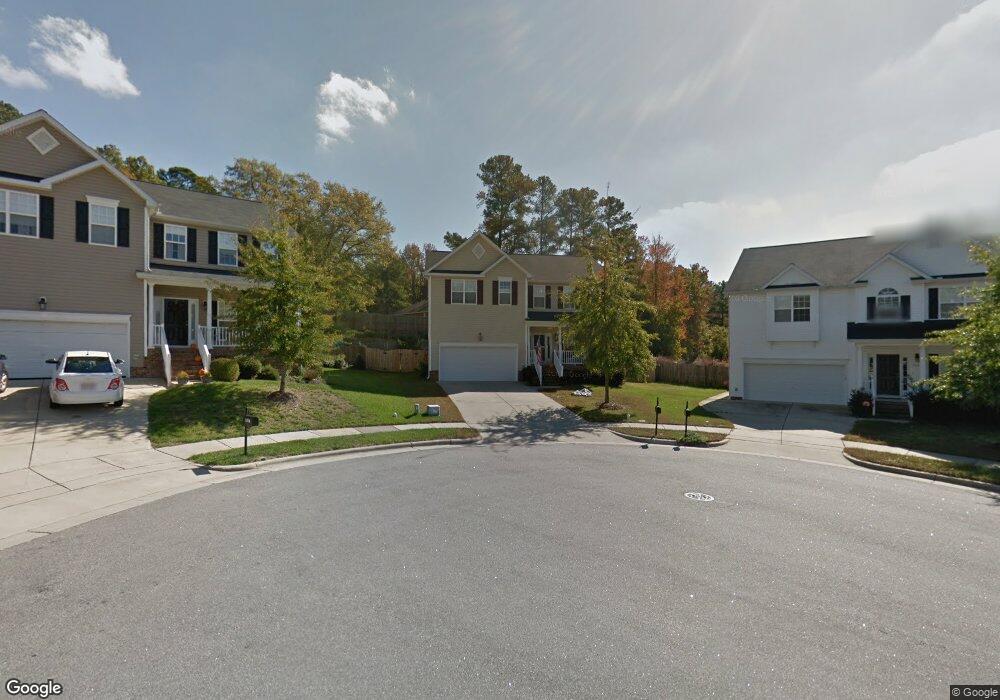
1012 Edinburgh Downs Ln Apex, NC 27502
West Apex NeighborhoodEstimated Value: $527,000 - $609,000
4
Beds
3
Baths
2,505
Sq Ft
$229/Sq Ft
Est. Value
About This Home
This home is located at 1012 Edinburgh Downs Ln, Apex, NC 27502 and is currently estimated at $573,115, approximately $228 per square foot. 1012 Edinburgh Downs Ln is a home located in Wake County with nearby schools including Scotts Ridge Elementary School, Apex Friendship Middle School, and Apex Friendship High School.
Ownership History
Date
Name
Owned For
Owner Type
Purchase Details
Closed on
Aug 12, 2009
Sold by
Garcia Alberto and Garcia Bridgette R Wage
Bought by
Sacco Marie
Current Estimated Value
Home Financials for this Owner
Home Financials are based on the most recent Mortgage that was taken out on this home.
Original Mortgage
$247,000
Outstanding Balance
$161,456
Interest Rate
5.26%
Mortgage Type
New Conventional
Estimated Equity
$411,659
Purchase Details
Closed on
Apr 12, 2006
Sold by
K Hovnanian Homes Of North Carolina Inc
Bought by
Garcia Alberto and Wage Bridgette R
Home Financials for this Owner
Home Financials are based on the most recent Mortgage that was taken out on this home.
Original Mortgage
$259,700
Interest Rate
6.31%
Mortgage Type
VA
Purchase Details
Closed on
Oct 28, 2005
Sold by
Crocketts Ridge Phase Ii Inc
Bought by
K Hovnanian Homes Of North Carolina Inc
Create a Home Valuation Report for This Property
The Home Valuation Report is an in-depth analysis detailing your home's value as well as a comparison with similar homes in the area
Home Values in the Area
Average Home Value in this Area
Purchase History
| Date | Buyer | Sale Price | Title Company |
|---|---|---|---|
| Sacco Marie | $268,500 | None Available | |
| Garcia Alberto | $285,500 | None Available | |
| K Hovnanian Homes Of North Carolina Inc | $172,000 | None Available |
Source: Public Records
Mortgage History
| Date | Status | Borrower | Loan Amount |
|---|---|---|---|
| Open | Sacco Marie | $247,000 | |
| Previous Owner | Garcia Alberto | $259,700 |
Source: Public Records
Tax History
| Year | Tax Paid | Tax Assessment Tax Assessment Total Assessment is a certain percentage of the fair market value that is determined by local assessors to be the total taxable value of land and additions on the property. | Land | Improvement |
|---|---|---|---|---|
| 2025 | $4,832 | $551,176 | $145,000 | $406,176 |
| 2024 | $4,724 | $551,176 | $145,000 | $406,176 |
Source: Public Records
Map
Nearby Homes
- 1124 Woodlands Creek Way
- 7104 Camp Branch Ln
- 2129 Kelly Rd
- 2516 Maroni Dr
- 2006 Leo Dr
- 2011 Becca Ct
- 2805 Evans Rd
- 2801 Evans Rd
- 1809 Barrett Run Trail
- 2170 Vittorio Ln
- 2030 Lazio Ln
- 2095 Maggie Valley Dr
- 2099 Maggie Valley Dr
- 1811 Aspen River Ln
- 3020 Holland Rd
- 106 Forestcrest Ct
- 1702 Melbry Ct
- 301 Kinship Ln
- 1216 Scotts Ridge Trail
- 2908 Evans Rd
- 1010 Edinburgh Downs Ln
- 1014 Edinburgh Downs Ln
- 1006 Woodlands Creek Way
- 1008 Edinburgh Downs Ln
- 2520 Holland Rd
- 1008 Woodlands Creek Way
- 1016 Edinburgh Downs Ln
- 1004 Woodlands Creek Way
- 1004 Edinburgh Downs Ln
- 1011 Edinburgh Downs Ln
- 1010 Woodlands Creek Way
- 1002 Woodlands Creek Way
- 1009 Edinburgh Downs Ln
- 2305 Pilot Mountain Ct
- 1000 Edinburgh Downs Ln
- 2303 Pilot Mountain Ct
- 2309 Pilot Mountain Ct
- 2002 Himalaya Way
- 1005 Edinburgh Downs Ln
- 1007 Edinburgh Downs Ln
Your Personal Tour Guide
Ask me questions while you tour the home.