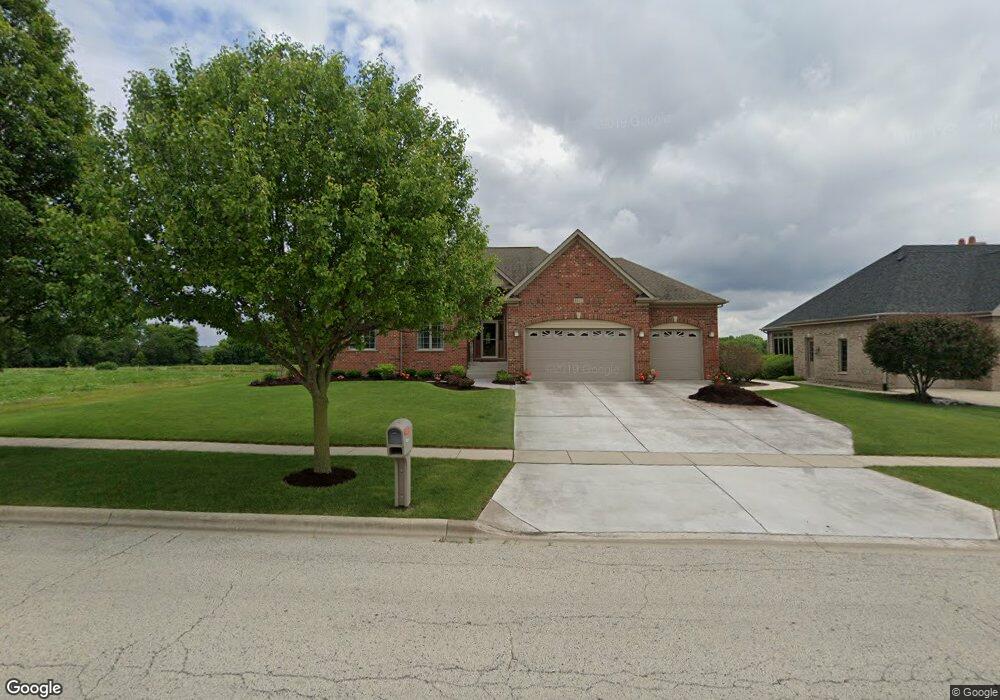
1012 Freedom Cir Sycamore, IL 60178
Estimated Value: $486,835 - $566,000
4
Beds
3
Baths
2,750
Sq Ft
$190/Sq Ft
Est. Value
About This Home
This home is located at 1012 Freedom Cir, Sycamore, IL 60178 and is currently estimated at $522,459, approximately $189 per square foot. 1012 Freedom Cir is a home located in DeKalb County with nearby schools including Sycamore High School, St Mary's Catholic School, and Cornerstone Christian Academy.
Ownership History
Date
Name
Owned For
Owner Type
Purchase Details
Closed on
Jun 8, 2017
Sold by
Lovell John W and Lovell Jennifer S
Bought by
Diedrich Kenneth J and Diedrich Jane M
Current Estimated Value
Home Financials for this Owner
Home Financials are based on the most recent Mortgage that was taken out on this home.
Original Mortgage
$289,600
Outstanding Balance
$148,467
Interest Rate
3.37%
Mortgage Type
New Conventional
Estimated Equity
$373,992
Purchase Details
Closed on
May 31, 2007
Sold by
Jeppesen & Veilichkoff Builder
Bought by
Lovell John W and Rempel Jennifer S
Home Financials for this Owner
Home Financials are based on the most recent Mortgage that was taken out on this home.
Original Mortgage
$225,000
Interest Rate
6.22%
Mortgage Type
New Conventional
Purchase Details
Closed on
May 20, 2005
Sold by
Krpans Parkside Estates Lp
Bought by
Jeppesen Veilichkoff Builders
Create a Home Valuation Report for This Property
The Home Valuation Report is an in-depth analysis detailing your home's value as well as a comparison with similar homes in the area
Home Values in the Area
Average Home Value in this Area
Purchase History
| Date | Buyer | Sale Price | Title Company |
|---|---|---|---|
| Diedrich Kenneth J | $362,000 | None Available | |
| Lovell John W | $462,000 | -- | |
| Jeppesen Veilichkoff Builders | $128,000 | -- |
Source: Public Records
Mortgage History
| Date | Status | Borrower | Loan Amount |
|---|---|---|---|
| Open | Diedrich Kenneth J | $289,600 | |
| Previous Owner | Lovell John W | $225,000 |
Source: Public Records
Tax History Compared to Growth
Tax History
| Year | Tax Paid | Tax Assessment Tax Assessment Total Assessment is a certain percentage of the fair market value that is determined by local assessors to be the total taxable value of land and additions on the property. | Land | Improvement |
|---|---|---|---|---|
| 2024 | $10,555 | $150,039 | $24,629 | $125,410 |
| 2023 | $10,523 | $124,189 | $23,041 | $101,148 |
| 2022 | $10,523 | $118,524 | $21,990 | $96,534 |
| 2021 | $10,175 | $112,848 | $20,937 | $91,911 |
| 2020 | $9,969 | $109,328 | $20,284 | $89,044 |
| 2019 | $9,608 | $104,741 | $19,433 | $85,308 |
| 2018 | $9,218 | $99,055 | $18,378 | $80,677 |
| 2017 | $8,917 | $94,302 | $17,496 | $76,806 |
| 2016 | $8,572 | $88,630 | $16,444 | $72,186 |
| 2015 | -- | $90,807 | $27,176 | $63,631 |
| 2014 | -- | $87,399 | $26,156 | $61,243 |
| 2013 | -- | $90,569 | $27,105 | $63,464 |
Source: Public Records
Map
Nearby Homes
- 668 E Becker Place
- Lot 239 Zagreb Ave
- Lot 240 Zagreb Ave
- Lot 228 Zagreb Ave
- Lot 229 Zagreb Ave
- Lot 226 Zagreb Ave
- Lot 227 Zagreb Ave
- Townsend Plan at Reston Ponds
- Brighton Plan at Reston Ponds
- Meadowlark Plan at Reston Ponds
- Starling Plan at Reston Ponds
- Siena II Plan at Reston Ponds
- Wren Plan at Reston Ponds
- 932 Juniper Dr
- 924 Juniper Dr
- 916 Juniper Dr
- 445 E Becker Place
- 935 Juniper Dr
- 1017 Juniper Dr
- 927 Juniper Dr
- 1020 Freedom Cir
- 1036 Freedom Cir
- 1035 Freedom Cir
- 942 Freedom Cir
- 935 Freedom Cir
- 934 Freedom Cir
- 103 Freedom Cir
- 257 Freedom Cir
- LOT 10 Freedom Cir
- Lot 57 Freedom Cir
- 926 Freedom Cir
- 1148 Freedom Cir
- 915 Freedom Cir
- 910 Freedom Cir
- 619 Emanuel Ln
- 1145 Freedom Cir
- 735 Independence Ave
- 1156 Freedom Cir
- 1164 Freedom Cir
- 1161 Freedom Cir