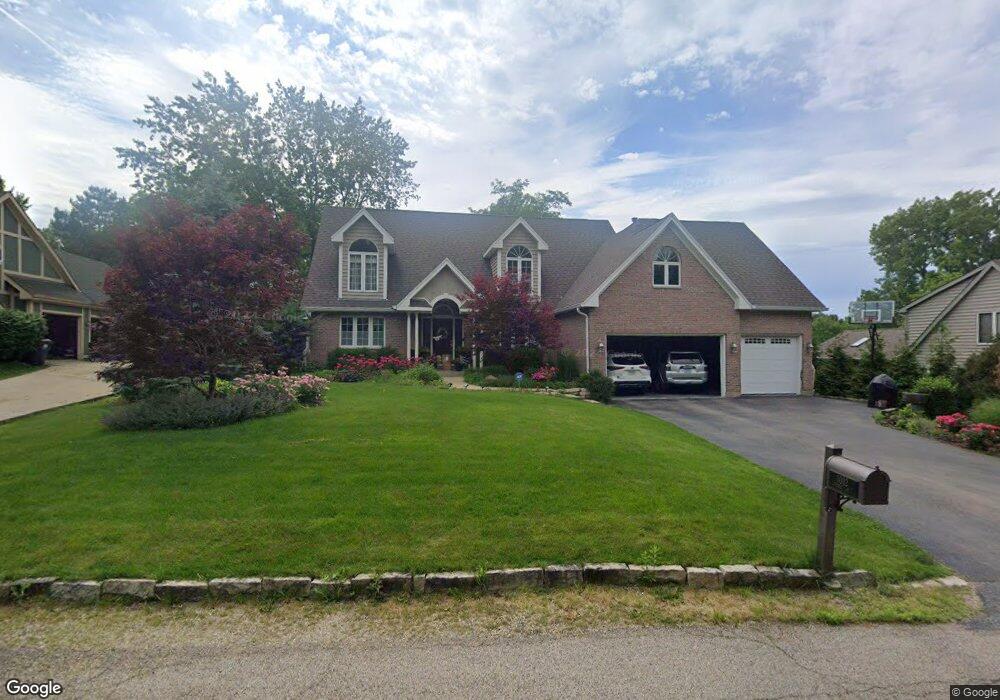
1012 George St Barrington, IL 60010
Estimated Value: $580,000 - $748,000
3
Beds
3
Baths
1,889
Sq Ft
$341/Sq Ft
Est. Value
About This Home
This home is located at 1012 George St, Barrington, IL 60010 and is currently estimated at $644,819, approximately $341 per square foot. 1012 George St is a home located in Cook County with nearby schools including Grove Avenue Elementary School, Barrington Mdle School- Prairie Cmps, and Barrington High School.
Ownership History
Date
Name
Owned For
Owner Type
Purchase Details
Closed on
Nov 5, 2002
Sold by
Griffin John J and Griffin Ronna L
Bought by
Griffin Gary and Griffin Lynette
Current Estimated Value
Home Financials for this Owner
Home Financials are based on the most recent Mortgage that was taken out on this home.
Original Mortgage
$220,000
Outstanding Balance
$86,880
Interest Rate
5.62%
Mortgage Type
Unknown
Estimated Equity
$557,940
Purchase Details
Closed on
Jul 25, 1995
Sold by
Griffin Gary and Griffin Lynette
Bought by
Griffin Gary and Griffin Lynette
Home Financials for this Owner
Home Financials are based on the most recent Mortgage that was taken out on this home.
Original Mortgage
$203,000
Interest Rate
7.56%
Purchase Details
Closed on
Jan 31, 1994
Sold by
Poetzsch John and Poetzsch Kathleen
Bought by
Griffin Gary and Griffin Lynette
Purchase Details
Closed on
Jan 24, 1994
Sold by
Goeppner Doris
Bought by
Griffin Gary and Griffin Lynette
Purchase Details
Closed on
Jan 30, 1993
Sold by
Now Elizabeth and Cechota Theodore
Bought by
Poetzsch Maria
Create a Home Valuation Report for This Property
The Home Valuation Report is an in-depth analysis detailing your home's value as well as a comparison with similar homes in the area
Home Values in the Area
Average Home Value in this Area
Purchase History
| Date | Buyer | Sale Price | Title Company |
|---|---|---|---|
| Griffin Gary | -- | First American Title | |
| Griffin Gary | -- | Ticor Title Insurance | |
| Griffin Gary | $14,333 | -- | |
| Griffin Gary | $28,333 | -- | |
| Griffin Gary | $14,333 | -- | |
| Poetzsch Maria | -- | -- |
Source: Public Records
Mortgage History
| Date | Status | Borrower | Loan Amount |
|---|---|---|---|
| Open | Griffin Gary | $220,000 | |
| Closed | Griffin Gary | $203,000 |
Source: Public Records
Tax History
| Year | Tax Paid | Tax Assessment Tax Assessment Total Assessment is a certain percentage of the fair market value that is determined by local assessors to be the total taxable value of land and additions on the property. | Land | Improvement |
|---|---|---|---|---|
| 2025 | $9,113 | $53,000 | $10,602 | $42,398 |
| 2024 | $9,113 | $43,730 | $8,835 | $34,895 |
| 2023 | $8,887 | $43,730 | $8,835 | $34,895 |
| 2022 | $8,887 | $43,730 | $8,835 | $34,895 |
| 2021 | $7,730 | $34,429 | $5,301 | $29,128 |
| 2020 | $7,519 | $34,429 | $5,301 | $29,128 |
| 2019 | $7,391 | $38,383 | $5,301 | $33,082 |
| 2018 | $8,840 | $43,889 | $4,859 | $39,030 |
| 2017 | $8,588 | $43,889 | $4,859 | $39,030 |
| 2016 | $8,275 | $43,889 | $4,859 | $39,030 |
| 2015 | $7,406 | $36,908 | $4,417 | $32,491 |
| 2014 | $7,337 | $36,908 | $4,417 | $32,491 |
| 2013 | $7,571 | $39,651 | $4,417 | $35,234 |
Source: Public Records
Map
Nearby Homes
- 650 S George St
- 1011 Prairie Ave
- 910 Division St
- 454 Harvard Ave
- 720 South St
- 917 S Grove Ave
- 1020 S Grove Ave
- 418 E Hillside Ave
- 1022 Oakland Dr
- 743 Skyline Dr
- 319 S Glendale Ave Unit 303
- 319 S Glendale Ave Unit 204
- 730 Skyline Dr
- 1431 Somerset Place
- 1419 Somerset Place
- 1442 Somerset Place
- 739 Meadow Ln
- 141 Kainer Ave
- 131 Walton St
- 123 Kainer Ave
- 1010 George St
- 1014 George St
- 1016 George St
- 1000 George St
- 1009 Prairie Ave
- 1013 Prairie Ave
- 1005 Prairie Ave
- 654 Harvard Ave
- 1017 Prairie Ave
- 1017 Prairie Ave
- 1010 Prairie Ave
- 1006 Prairie Ave
- 1014 Prairie Ave
- 541 Yale St
- 1016 Prairie Ave
- 651 Harvard Ave
- 1122 George St
- 1017 S Division St
- 1001 S Division St
- 1015 Division St
Your Personal Tour Guide
Ask me questions while you tour the home.