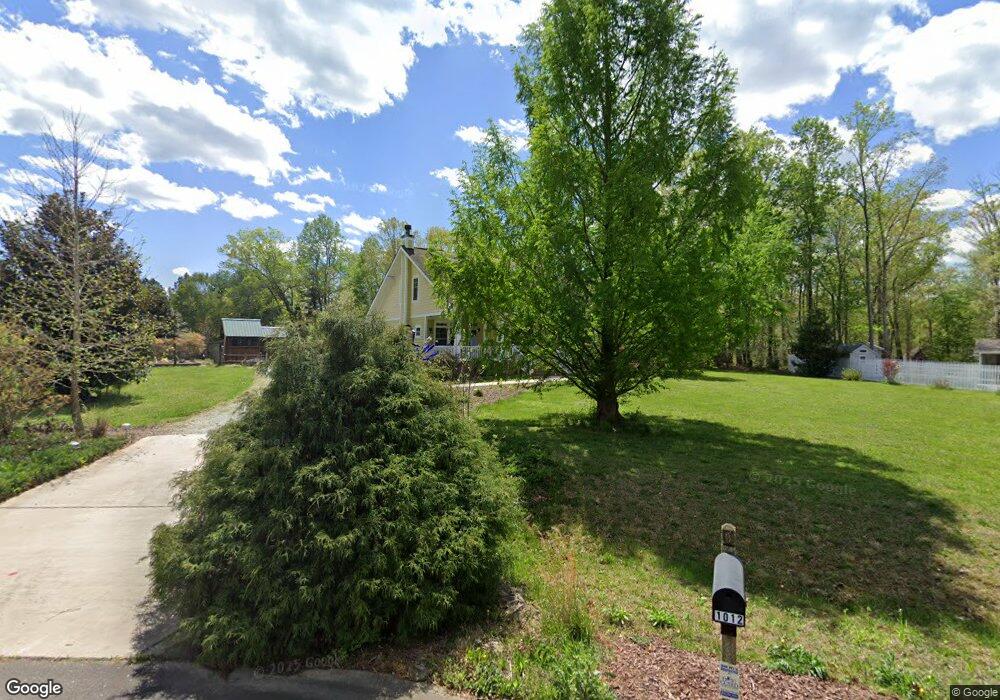
1012 Grassland Ct Hillsborough, NC 27278
Estimated Value: $545,511 - $618,000
3
Beds
3
Baths
2,007
Sq Ft
$292/Sq Ft
Est. Value
About This Home
This home is located at 1012 Grassland Ct, Hillsborough, NC 27278 and is currently estimated at $585,378, approximately $291 per square foot. 1012 Grassland Ct is a home located in Orange County with nearby schools including Grady Brown Elementary School, A.L. Stanback Middle School, and Cedar Ridge High.
Ownership History
Date
Name
Owned For
Owner Type
Purchase Details
Closed on
Feb 4, 2021
Sold by
Rosensweet Meghan and Rosensweet Mitchell Jay
Bought by
Rosensweet Mitchell Jay
Current Estimated Value
Home Financials for this Owner
Home Financials are based on the most recent Mortgage that was taken out on this home.
Original Mortgage
$288,500
Outstanding Balance
$257,215
Interest Rate
2.65%
Mortgage Type
New Conventional
Estimated Equity
$328,163
Purchase Details
Closed on
Nov 10, 2016
Sold by
Brockway Kenneth Andrew and Moulder Catherine
Bought by
Rosensweet Mitchell Jay and Rosensweet Meghan
Home Financials for this Owner
Home Financials are based on the most recent Mortgage that was taken out on this home.
Original Mortgage
$236,250
Interest Rate
3.42%
Mortgage Type
New Conventional
Purchase Details
Closed on
Nov 17, 2009
Sold by
Christopher Road Realty Inc
Bought by
Brockway Kenneth Andrew and Moulder Kati
Create a Home Valuation Report for This Property
The Home Valuation Report is an in-depth analysis detailing your home's value as well as a comparison with similar homes in the area
Home Values in the Area
Average Home Value in this Area
Purchase History
| Date | Buyer | Sale Price | Title Company |
|---|---|---|---|
| Rosensweet Mitchell Jay | -- | None Available | |
| Rosensweet Mitchell Jay | $337,500 | None Available | |
| Brockway Kenneth Andrew | $61,000 | None Available |
Source: Public Records
Mortgage History
| Date | Status | Borrower | Loan Amount |
|---|---|---|---|
| Open | Rosensweet Mitchell Jay | $288,500 | |
| Closed | Rosensweet Mitchell Jay | $236,250 |
Source: Public Records
Tax History Compared to Growth
Tax History
| Year | Tax Paid | Tax Assessment Tax Assessment Total Assessment is a certain percentage of the fair market value that is determined by local assessors to be the total taxable value of land and additions on the property. | Land | Improvement |
|---|---|---|---|---|
| 2025 | $4,160 | $550,600 | $150,000 | $400,600 |
| 2024 | $3,703 | $364,600 | $72,000 | $292,600 |
| 2023 | $3,570 | $364,600 | $72,000 | $292,600 |
| 2022 | $3,519 | $364,600 | $72,000 | $292,600 |
| 2021 | $3,473 | $364,600 | $72,000 | $292,600 |
| 2020 | $3,344 | $332,600 | $72,000 | $260,600 |
| 2018 | $3,265 | $332,600 | $72,000 | $260,600 |
| 2017 | $3,124 | $332,600 | $72,000 | $260,600 |
| 2016 | $3,124 | $313,700 | $66,100 | $247,600 |
| 2015 | $3,164 | $317,904 | $66,085 | $251,819 |
| 2014 | $3,112 | $317,904 | $66,085 | $251,819 |
Source: Public Records
Map
Nearby Homes
- 2013 Peninsula Ln
- 2707 Moorefields Rd
- 2201 Moorefields Rd
- 2418 Crossroads Ave
- 00 Ode Turner Rd
- 1455 Dimmocks Mill Rd
- 2415 Davis Rd
- 2334 Blair Dr
- 2601 Myrtle Ln
- 675 Oakdale Dr
- 2606 Brick Hearth Dr
- 2310 Hardwood Dr
- 0 Davis Rd Unit 1189441
- 0 Davis Rd Unit 10115163
- 2304 Hardwood Dr
- 1021 Dimmocks Mill Rd
- 408 Patriot Place
- 806 Davis Rd
- 1423 Davis Rd
- 2118 Magnolia Ln
- 1000 Grassland Ct
- 1022 Grassland Ct
- 1022 Grassland Ct Unit 14
- 2002 Peninsula Ln
- 5 Peninsula Ln
- 10 Peninsula Ln
- 6 Peninsula Ln
- 2 Peninsula Ln
- 9 Peninsula Ln
- 1 Peninsula Ln
- 8 Peninsula Ln
- 16 Peninsula Ln
- 17 Peninsula Ln
- 2106 Peninsula Ln
- 2000 Peninsula Ln
- 2014 Peninsula Ln
- Lot 1 Peninsula Ln
- Lot 9 Peninsula Ln
- Lot 10 Peninsula Ln
- Lot 8 Peninsula Ln