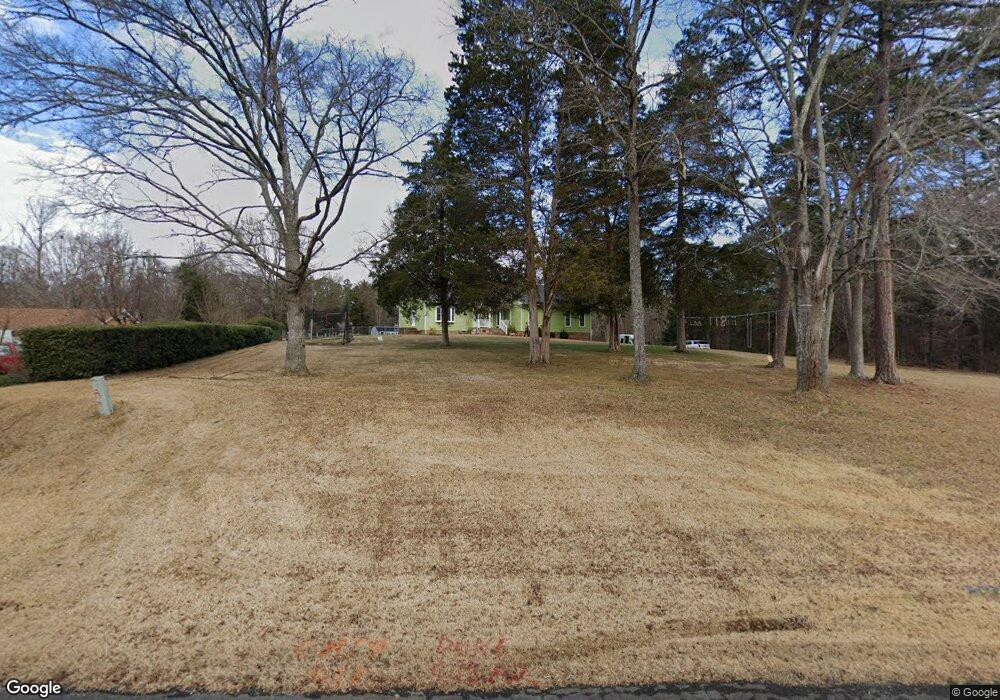
1012 Lake Shore Dr Belmont, NC 28012
Estimated Value: $405,000 - $537,000
3
Beds
2
Baths
2,475
Sq Ft
$200/Sq Ft
Est. Value
About This Home
This home is located at 1012 Lake Shore Dr, Belmont, NC 28012 and is currently estimated at $495,316, approximately $200 per square foot. 1012 Lake Shore Dr is a home located in Gaston County with nearby schools including New Hope Elementary School, Cramerton Middle School, and South Point High School.
Ownership History
Date
Name
Owned For
Owner Type
Purchase Details
Closed on
Dec 31, 2014
Sold by
Powell Properties Of Nc Llc
Bought by
Lampkin Chris and Lampkin Jaime
Current Estimated Value
Home Financials for this Owner
Home Financials are based on the most recent Mortgage that was taken out on this home.
Original Mortgage
$215,450
Outstanding Balance
$168,949
Interest Rate
4.5%
Mortgage Type
Adjustable Rate Mortgage/ARM
Estimated Equity
$326,367
Purchase Details
Closed on
Aug 27, 2014
Sold by
Via Elaine H
Bought by
State Employees Cu
Purchase Details
Closed on
May 15, 2001
Sold by
Via William S
Bought by
Via Elaine H
Home Financials for this Owner
Home Financials are based on the most recent Mortgage that was taken out on this home.
Original Mortgage
$137,060
Interest Rate
6.98%
Create a Home Valuation Report for This Property
The Home Valuation Report is an in-depth analysis detailing your home's value as well as a comparison with similar homes in the area
Home Values in the Area
Average Home Value in this Area
Purchase History
| Date | Buyer | Sale Price | Title Company |
|---|---|---|---|
| Lampkin Chris | $215,500 | None Available | |
| State Employees Cu | $110,850 | None Available | |
| Via Elaine H | -- | -- |
Source: Public Records
Mortgage History
| Date | Status | Borrower | Loan Amount |
|---|---|---|---|
| Open | Lampkin Chris | $215,450 | |
| Previous Owner | Via Elaine H | $137,060 |
Source: Public Records
Tax History Compared to Growth
Tax History
| Year | Tax Paid | Tax Assessment Tax Assessment Total Assessment is a certain percentage of the fair market value that is determined by local assessors to be the total taxable value of land and additions on the property. | Land | Improvement |
|---|---|---|---|---|
| 2025 | $2,995 | $419,470 | $42,970 | $376,500 |
| 2024 | $2,995 | $419,470 | $42,970 | $376,500 |
| 2023 | $2,915 | $419,470 | $42,970 | $376,500 |
| 2022 | $2,133 | $231,800 | $36,680 | $195,120 |
| 2021 | $2,149 | $231,800 | $36,680 | $195,120 |
| 2019 | $2,142 | $231,800 | $36,680 | $195,120 |
| 2018 | $1,890 | $194,868 | $34,953 | $159,915 |
| 2017 | $1,867 | $194,868 | $34,953 | $159,915 |
| 2016 | $1,867 | $194,868 | $0 | $0 |
| 2014 | $1,626 | $171,115 | $42,685 | $128,430 |
Source: Public Records
Map
Nearby Homes
- 1011 Lake Shore Dr
- 236 Paradise Dr
- 2613 Lake Front Dr
- 253 Lanyard Ln
- 2633 Lake Front Dr
- 463 Lake Wylie Rd
- Drayton Plan at Michaux Gardens
- Townsend Plan at Michaux Gardens
- Jordan Plan at Michaux Gardens
- Norris Plan at Michaux Gardens
- Stonefield Plan at Michaux Gardens
- Fairfield Plan at Michaux Gardens
- Cooper 3 Plan at Michaux Gardens
- Stonehaven Plan at Michaux Gardens
- Burton Plan at Michaux Gardens
- Devon Plan at Michaux Gardens
- Boyd Plan at Seven Oaks
- Torrence Plan at Seven Oaks
- Stowe Plan at Seven Oaks
- Allison Plan at Seven Oaks
- 1024 Lake Shore Dr
- 121 Moonlight Way
- 1007 Lake Shore Dr
- 115 Moonlight Way
- 125 Moonlight Way
- 201 Paradise Dr
- 1025 Lake Shore Dr
- 199 Paradise Dr
- 113 Moonlight Way
- 203 Paradise Dr
- 000 Paradise Dr
- 0000 Paradise Dr
- 236,232,228 Paradise Dr
- 1031 Lake Shore Dr
- 205 Paradise Dr
- 207 Paradise Dr
- 198 Paradise Dr
- 118 Moonlight Way
- 111 Moonlight Way
- 124 Moonlight Way