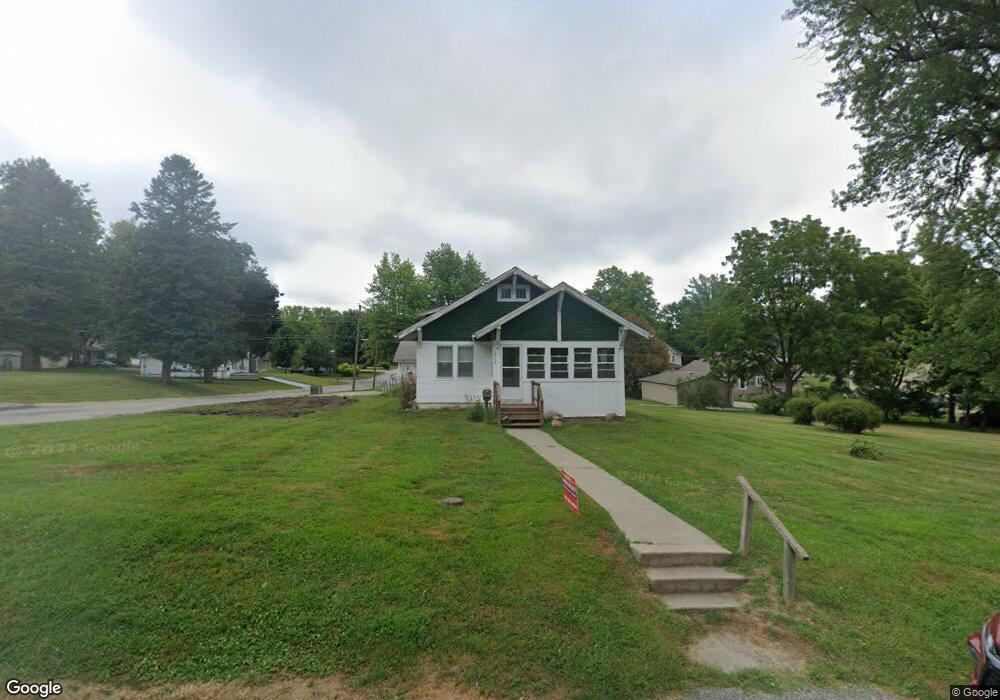
1012 Maple St Tarkio, MO 64491
Estimated Value: $84,000 - $134,000
Studio
--
Bath
1,092
Sq Ft
$106/Sq Ft
Est. Value
About This Home
This home is located at 1012 Maple St, Tarkio, MO 64491 and is currently estimated at $116,295, approximately $106 per square foot. 1012 Maple St is a home with nearby schools including Tarkio Elementary School and Tarkio High School.
Ownership History
Date
Name
Owned For
Owner Type
Purchase Details
Closed on
Nov 5, 2020
Sold by
Hogue Derek B
Bought by
Whitaker Terry and Whitaker Racy A
Current Estimated Value
Purchase Details
Closed on
Feb 1, 2012
Sold by
Austin Helen C
Bought by
Hogue Derek B and Hogue Tracy A
Purchase Details
Closed on
Jan 27, 2000
Sold by
Brown Lloyd N and Brown Leola D
Bought by
Austin Helen C
Purchase Details
Closed on
Nov 3, 1997
Sold by
Halliday Halliday
Bought by
Brown Lloyd N and Brown Leola D
Purchase Details
Closed on
Oct 23, 1985
Sold by
Melvin Mary
Bought by
Slater Halliday Halliday
Purchase Details
Closed on
Feb 2, 1966
Sold by
Watson Dean J and Watson Jane R
Bought by
Melvin Mary
Create a Home Valuation Report for This Property
The Home Valuation Report is an in-depth analysis detailing your home's value as well as a comparison with similar homes in the area
Purchase History
| Date | Buyer | Sale Price | Title Company |
|---|---|---|---|
| Whitaker Terry | -- | -- | |
| Hogue Derek B | $53,000 | -- | |
| Austin Helen C | $50,300 | -- | |
| Brown Lloyd N | $18,000 | -- | |
| Slater Halliday Halliday | -- | -- | |
| Melvin Mary | -- | -- |
Source: Public Records
Tax History
| Year | Tax Paid | Tax Assessment Tax Assessment Total Assessment is a certain percentage of the fair market value that is determined by local assessors to be the total taxable value of land and additions on the property. | Land | Improvement |
|---|---|---|---|---|
| 2025 | $1,236 | $81,810 | $0 | $0 |
| 2024 | $1,076 | $13,756 | $2,470 | $11,286 |
| 2023 | $1,072 | $13,756 | $2,470 | $11,286 |
| 2022 | $97,272 | $65,800 | $2,242 | $10,260 |
| 2021 | $890 | $12,502 | $2,242 | $10,260 |
| 2020 | $890 | $11,362 | $0 | $11,362 |
| 2019 | $884 | $11,362 | $0 | $11,362 |
| 2018 | -- | $11,362 | $2,033 | $9,329 |
| 2017 | -- | $11,362 | $2,033 | $9,329 |
| 2016 | -- | $11,362 | $2,033 | $9,329 |
| 2015 | -- | $11,362 | $2,033 | $9,329 |
| 2012 | -- | $10,621 | $0 | $0 |
Source: Public Records
Map
Nearby Homes
Your Personal Tour Guide
Ask me questions while you tour the home.