Estimated Value: $104,740 - $142,000
2
Beds
1
Bath
960
Sq Ft
$130/Sq Ft
Est. Value
About This Home
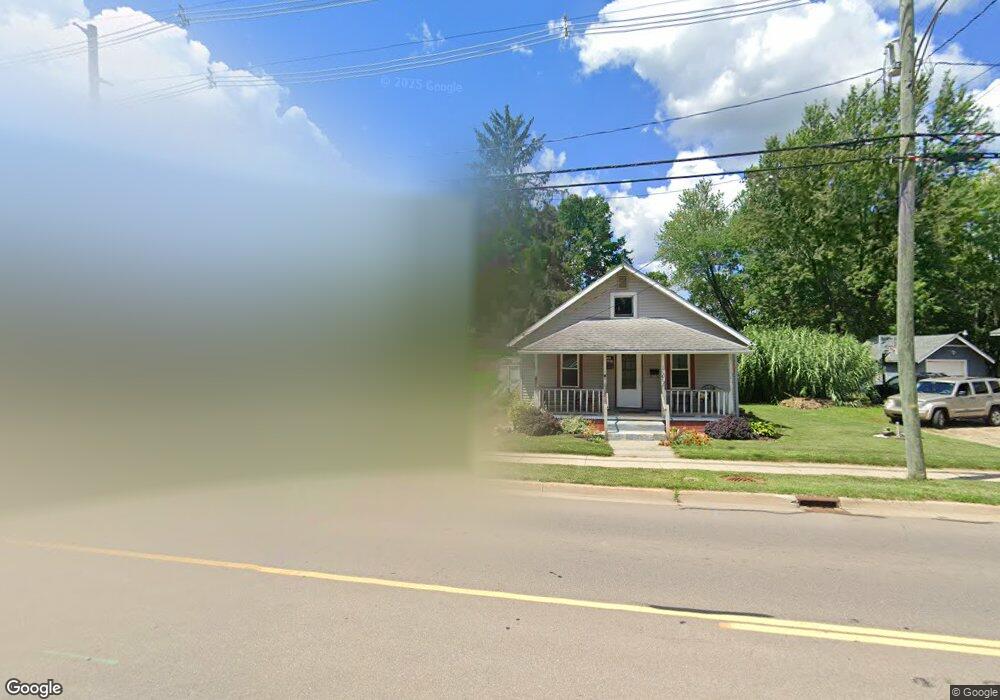
This home is located at 1012 N 5th St, Niles, MI 49120 and is currently estimated at $124,935, approximately $130 per square foot. 1012 N 5th St is a home located in Berrien County with nearby schools including James Ellis School, Howard-Ellis Elementary School, and Ring Lardner Middle School.
Ownership History
Date
Name
Owned For
Owner Type
Purchase Details
Closed on
Jan 2, 2003
Sold by
Mcquaid Jerome T
Bought by
Boyd George
Current Estimated Value
Home Financials for this Owner
Home Financials are based on the most recent Mortgage that was taken out on this home.
Original Mortgage
$23,900
Outstanding Balance
$10,278
Interest Rate
6.13%
Estimated Equity
$114,657
Purchase Details
Closed on
May 12, 1992
Purchase Details
Closed on
Jun 22, 1982
Purchase Details
Closed on
May 12, 1969
Create a Home Valuation Report for This Property
The Home Valuation Report is an in-depth analysis detailing your home's value as well as a comparison with similar homes in the area
Home Values in the Area
Average Home Value in this Area
Purchase History
| Date | Buyer | Sale Price | Title Company |
|---|---|---|---|
| Boyd George | $25,000 | Meridian Title Corp | |
| -- | $25,000 | -- | |
| -- | $7,000 | -- | |
| -- | $7,000 | -- |
Source: Public Records
Mortgage History
| Date | Status | Borrower | Loan Amount |
|---|---|---|---|
| Open | Boyd George | $23,900 |
Source: Public Records
Tax History Compared to Growth
Tax History
| Year | Tax Paid | Tax Assessment Tax Assessment Total Assessment is a certain percentage of the fair market value that is determined by local assessors to be the total taxable value of land and additions on the property. | Land | Improvement |
|---|---|---|---|---|
| 2025 | $703 | $40,600 | $0 | $0 |
| 2024 | $535 | $40,100 | $0 | $0 |
| 2023 | $513 | $30,200 | $0 | $0 |
| 2022 | $489 | $21,700 | $0 | $0 |
| 2021 | $610 | $20,200 | $1,600 | $18,600 |
| 2020 | $604 | $20,100 | $0 | $0 |
| 2019 | $596 | $19,000 | $1,400 | $17,600 |
| 2018 | $577 | $19,000 | $0 | $0 |
| 2017 | $568 | $22,300 | $0 | $0 |
| 2016 | $556 | $17,300 | $0 | $0 |
| 2015 | $554 | $21,200 | $0 | $0 |
| 2014 | $424 | $18,200 | $0 | $0 |
Source: Public Records
Map
Nearby Homes