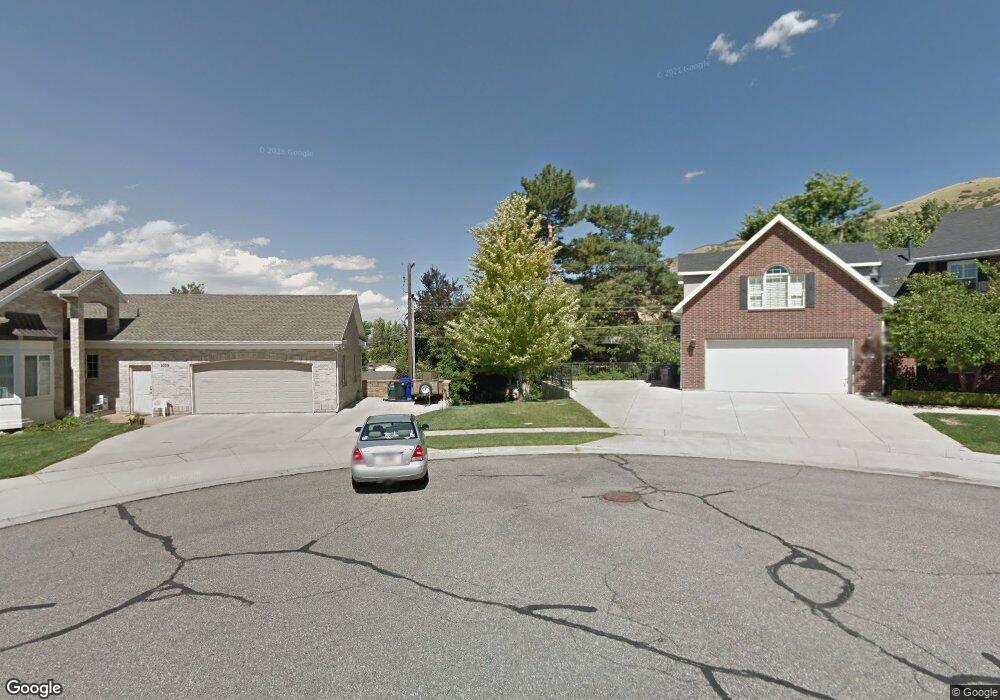
1012 N 725 E Bountiful, UT 84010
--
Bed
--
Bath
3,356
Sq Ft
10,454
Sq Ft Lot
About This Home
This home is located at 1012 N 725 E, Bountiful, UT 84010. 1012 N 725 E is a home located in Davis County with nearby schools including Tolman School, Bountiful Junior High School, and Viewmont High School.
Create a Home Valuation Report for This Property
The Home Valuation Report is an in-depth analysis detailing your home's value as well as a comparison with similar homes in the area
Tax History
| Year | Tax Paid | Tax Assessment Tax Assessment Total Assessment is a certain percentage of the fair market value that is determined by local assessors to be the total taxable value of land and additions on the property. | Land | Improvement |
|---|---|---|---|---|
| 2024 | $6,320 | $615,450 | $131,942 | $483,508 |
| 2023 | $5,742 | $1,011,000 | $239,758 | $771,242 |
| 2022 | $5,277 | $507,650 | $127,742 | $379,908 |
| 2021 | $4,662 | $686,000 | $189,906 | $496,094 |
| 2020 | $4,179 | $619,000 | $172,908 | $446,092 |
| 2019 | $4,156 | $601,000 | $169,162 | $431,838 |
| 2018 | $3,786 | $539,000 | $157,299 | $381,701 |
| 2016 | $3,599 | $278,630 | $50,700 | $227,930 |
| 2015 | $3,650 | $263,120 | $50,700 | $212,420 |
| 2014 | $4,352 | $329,295 | $50,700 | $278,595 |
| 2013 | -- | $277,020 | $48,340 | $228,680 |
Source: Public Records
Map
Nearby Homes
- 662 E 1200 N
- 975 E 1050 N
- 1023 E 800 N
- 908 Northern Hills Dr Unit 3
- 1105 E 600 N
- 933 Northern Hills Cir
- 610 E Pages Ln
- 453 N 400 E Unit 7-D
- 345 N 400 E
- 683 E 100 N
- 1342 Northridge Dr
- 1420 N Main St
- 967 S Courtyard Ln
- 610 S 800 E
- 345 E 600 S
- 150 E 735 S Unit 23
- 1342 E Skyline Dr N Unit 30
- 49 E 200 N Unit 4
- 41 E 200 N Unit 6
- 55 E 200 N Unit 2
Your Personal Tour Guide
Ask me questions while you tour the home.