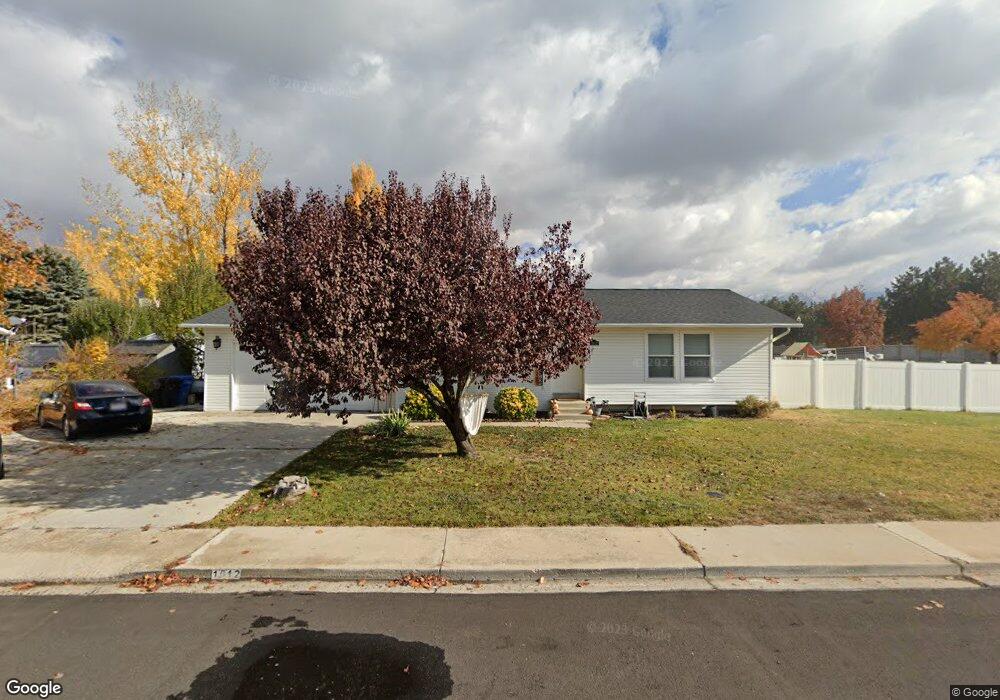
1012 N 750 W Orem, UT 84057
Bonneville NeighborhoodEstimated Value: $547,617 - $591,000
6
Beds
3
Baths
2,080
Sq Ft
$271/Sq Ft
Est. Value
About This Home
This home is located at 1012 N 750 W, Orem, UT 84057 and is currently estimated at $563,654, approximately $270 per square foot. 1012 N 750 W is a home located in Utah County with nearby schools including Bonneville Elementary School, Orem Junior High School, and Timpanogos High School.
Ownership History
Date
Name
Owned For
Owner Type
Purchase Details
Closed on
Jun 6, 2016
Sold by
Ramirez Giovana
Bought by
Ramirez Wiliam H and Ramirez Giovana
Current Estimated Value
Purchase Details
Closed on
Aug 3, 2005
Sold by
Ramirez William and Ramirez Giovana
Bought by
Ramirez Giovana
Home Financials for this Owner
Home Financials are based on the most recent Mortgage that was taken out on this home.
Original Mortgage
$152,900
Outstanding Balance
$79,286
Interest Rate
5.46%
Mortgage Type
Fannie Mae Freddie Mac
Estimated Equity
$484,368
Purchase Details
Closed on
Mar 31, 2000
Sold by
Gordon Susan J
Bought by
Ramirez William and Ramirez Giovana
Home Financials for this Owner
Home Financials are based on the most recent Mortgage that was taken out on this home.
Original Mortgage
$136,202
Interest Rate
8.3%
Mortgage Type
FHA
Create a Home Valuation Report for This Property
The Home Valuation Report is an in-depth analysis detailing your home's value as well as a comparison with similar homes in the area
Home Values in the Area
Average Home Value in this Area
Purchase History
| Date | Buyer | Sale Price | Title Company |
|---|---|---|---|
| Ramirez Wiliam H | -- | None Available | |
| Ramirez Giovana | -- | Horizon Title Insurance | |
| Ramirez William | -- | Empire Land Title Company |
Source: Public Records
Mortgage History
| Date | Status | Borrower | Loan Amount |
|---|---|---|---|
| Open | Ramirez Giovana | $152,900 | |
| Closed | Ramirez William | $136,202 |
Source: Public Records
Tax History Compared to Growth
Tax History
| Year | Tax Paid | Tax Assessment Tax Assessment Total Assessment is a certain percentage of the fair market value that is determined by local assessors to be the total taxable value of land and additions on the property. | Land | Improvement |
|---|---|---|---|---|
| 2025 | $1,869 | $302,005 | $194,400 | $354,700 |
| 2024 | $1,869 | $228,580 | $0 | $0 |
| 2023 | $1,710 | $224,675 | $0 | $0 |
| 2022 | $1,750 | $222,860 | $0 | $0 |
| 2021 | $1,629 | $314,200 | $151,800 | $162,400 |
| 2020 | $1,480 | $280,600 | $121,400 | $159,200 |
| 2019 | $1,405 | $277,000 | $121,400 | $155,600 |
| 2018 | $1,360 | $256,200 | $111,000 | $145,200 |
| 2017 | $1,279 | $128,975 | $0 | $0 |
| 2016 | $1,309 | $121,770 | $0 | $0 |
| 2015 | $1,241 | $109,175 | $0 | $0 |
| 2014 | $1,126 | $98,615 | $0 | $0 |
Source: Public Records
Map
Nearby Homes
- 947 N 830 W
- 875 W 1130 N
- 933 N 900 W
- 930 N 980 W
- 999 W 1100 N
- 982 W 960 N Unit 109
- 983 W 1055 N Unit 816
- 1030 N 995 W Unit 915
- 1015 N 995 W
- 738 N 835 W
- 1081 W 993 N Unit 101
- 1081 W 993 N Unit 202
- 1026 N 1090 W Unit 404
- 582 W 1300 N
- 697 W 1400 N
- 1140 W 950 N Unit D304
- 597 W 1400 N
- 1415 N 550 West St
- 417 W 750 N
- 587 N 550 W