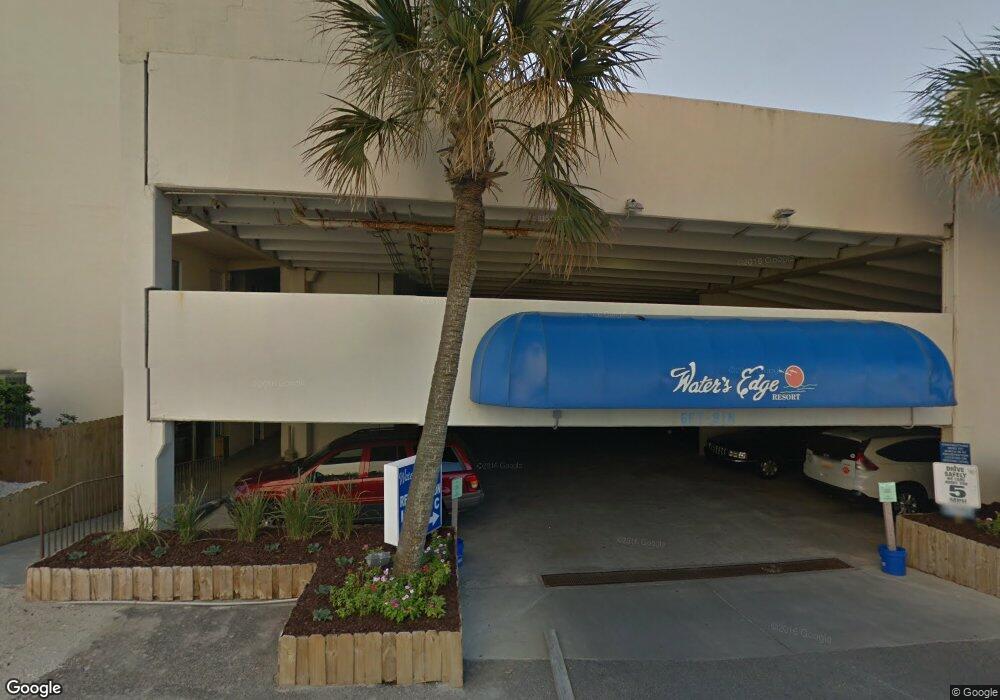
1012 N Waccamaw Dr Unit 1412 Murrells Inlet, SC 29576
Estimated Value: $477,412 - $521,000
3
Beds
3
Baths
1,331
Sq Ft
$372/Sq Ft
Est. Value
About This Home
This home is located at 1012 N Waccamaw Dr Unit 1412, Murrells Inlet, SC 29576 and is currently estimated at $495,603, approximately $372 per square foot. 1012 N Waccamaw Dr Unit 1412 is a home located in Horry County with nearby schools including Seaside Elementary, St. James Middle School, and St. James Intermediate.
Ownership History
Date
Name
Owned For
Owner Type
Purchase Details
Closed on
Apr 29, 2005
Sold by
Reddy William J and Reddy Kathleen
Bought by
Martin Joseph D
Current Estimated Value
Purchase Details
Closed on
Dec 12, 2002
Sold by
Morgan James R and Morgan Beverely G
Bought by
Treadwell Roy P and Treadwell Carol
Purchase Details
Closed on
Dec 27, 2000
Sold by
Schuster Lars A and Schuster Lauri L
Bought by
Morgan James R and Morgan Beverely G
Home Financials for this Owner
Home Financials are based on the most recent Mortgage that was taken out on this home.
Original Mortgage
$181,900
Interest Rate
7.65%
Mortgage Type
Purchase Money Mortgage
Purchase Details
Closed on
Nov 17, 1998
Sold by
Inn Way Inc
Bought by
Schuster Lars A and Schuster Lauri L
Home Financials for this Owner
Home Financials are based on the most recent Mortgage that was taken out on this home.
Original Mortgage
$119,000
Interest Rate
7.25%
Mortgage Type
Purchase Money Mortgage
Create a Home Valuation Report for This Property
The Home Valuation Report is an in-depth analysis detailing your home's value as well as a comparison with similar homes in the area
Home Values in the Area
Average Home Value in this Area
Purchase History
| Date | Buyer | Sale Price | Title Company |
|---|---|---|---|
| Martin Joseph D | $270,000 | -- | |
| Treadwell Roy P | $210,000 | -- | |
| Morgan James R | $191,500 | -- | |
| Schuster Lars A | $164,000 | -- |
Source: Public Records
Mortgage History
| Date | Status | Borrower | Loan Amount |
|---|---|---|---|
| Previous Owner | Morgan James R | $181,900 | |
| Previous Owner | Schuster Lars A | $119,000 |
Source: Public Records
Tax History Compared to Growth
Tax History
| Year | Tax Paid | Tax Assessment Tax Assessment Total Assessment is a certain percentage of the fair market value that is determined by local assessors to be the total taxable value of land and additions on the property. | Land | Improvement |
|---|---|---|---|---|
| 2024 | $3,873 | $28,800 | $0 | $28,800 |
| 2023 | $3,873 | $31,080 | $0 | $31,080 |
| 2021 | $3,327 | $31,080 | $0 | $31,080 |
| 2020 | $3,195 | $31,080 | $0 | $31,080 |
| 2019 | $3,195 | $31,080 | $0 | $31,080 |
| 2018 | $0 | $24,150 | $0 | $24,150 |
| 2017 | $2,865 | $13,800 | $0 | $13,800 |
| 2016 | -- | $13,800 | $0 | $13,800 |
| 2015 | $2,865 | $24,150 | $0 | $24,150 |
| 2014 | $2,711 | $13,800 | $0 | $13,800 |
Source: Public Records
Map
Nearby Homes
- 1012 N Waccamaw Dr Unit 203
- 1012 N Waccamaw Dr Unit 407
- 1012 N Waccamaw Dr Unit 305
- 1012 N Waccamaw Dr Unit 1410
- 1012 N Waccamaw Dr Unit 204
- 1108 N Waccamaw Dr Unit 402
- 1108 N Waccamaw Dr Unit 304
- 919 N Waccamaw Dr
- 1000 N Waccamaw Dr Unit 302
- 920 N Waccamaw Dr Unit 1404
- 920 N Waccamaw Dr Unit 2301 Carolina Shores
- 920 N Waccamaw Dr Unit 2102 Carolina Shore
- 1211 N Waccamaw Dr Unit A
- 912 N Waccamaw Dr Unit 1006
- 912 N Waccamaw Dr Unit 805
- 1211-B N Waccamaw Dr
- 113 Vista Dr
- 1210 N Waccamaw Dr Unit 203
- 1210 N Waccamaw Dr Unit 602
- 1210 N Waccamaw Dr Unit 402
- 1012 N Waccamaw Dr Unit 209
- 1012 N Waccamaw Dr Unit 1207
- 1012 N Waccamaw Dr Unit 12013
- 1012 N Waccamaw Dr Unit 110
- 1012 N Waccamaw Dr Unit Waters Edge 510
- 1012 N Waccamaw Dr Unit 607 Waters Edge
- 1012 N Waccamaw Dr Unit 705 Waters Edge
- 1012 N Waccamaw Dr Unit 1201 Waters Edge
- 1012 N Waccamaw Dr Unit 208 WATERS EDG
- 1012 N Waccamaw Dr Unit 701 Waters Edge Reso
- 1012 N Waccamaw Dr Unit 1401 Waters Edge
- 1012 N Waccamaw Dr Unit Waters Edge Resort
- 1012 N Waccamaw Dr Unit 1404 Water's Edge Re
- 1012 N Waccamaw Dr Unit 212
- 1012 N Waccamaw Dr Unit 1512
- 1012 N Waccamaw Dr Unit Waters Edge
- 1012 N Waccamaw Dr Unit Waters Edge 701
- 1012 N Waccamaw Dr Unit 210 Waters Edge
- 1012 N Waccamaw Dr Unit 1512 Waters Edge
- 1012 N Waccamaw Dr Unit 212 Waters Edge