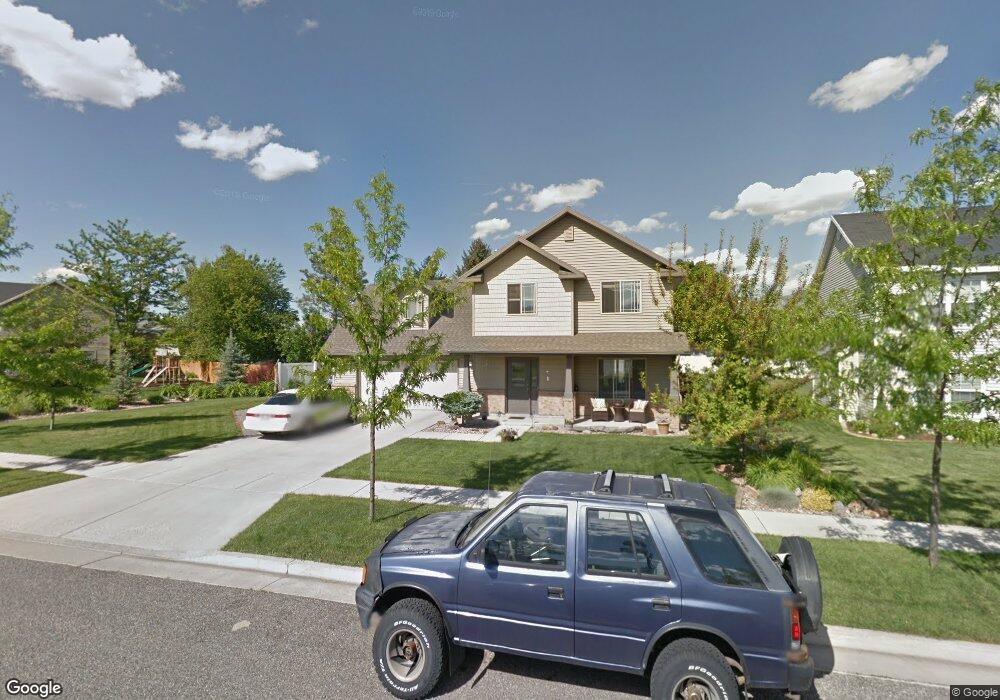
1012 Southgate Ct Logan, UT 84321
Woodruff NeighborhoodEstimated Value: $451,000 - $483,000
4
Beds
3
Baths
2,108
Sq Ft
$222/Sq Ft
Est. Value
About This Home
This home is located at 1012 Southgate Ct, Logan, UT 84321 and is currently estimated at $467,662, approximately $221 per square foot. 1012 Southgate Ct is a home located in Cache County with nearby schools including Woodruff School, Mount Logan Middle School, and Logan High School.
Ownership History
Date
Name
Owned For
Owner Type
Purchase Details
Closed on
May 18, 2021
Sold by
Hamblin Gary Ray and Hamblin Kristin
Bought by
Hamblin Kristin and Hamblin Gary Ray
Current Estimated Value
Home Financials for this Owner
Home Financials are based on the most recent Mortgage that was taken out on this home.
Original Mortgage
$130,000
Outstanding Balance
$97,772
Interest Rate
3.1%
Mortgage Type
New Conventional
Estimated Equity
$369,890
Purchase Details
Closed on
Aug 27, 2010
Sold by
Sanchez John and Sanchez Julee
Bought by
Hamblin Gary Ray and Hamblin Kristin
Home Financials for this Owner
Home Financials are based on the most recent Mortgage that was taken out on this home.
Original Mortgage
$177,450
Interest Rate
4.52%
Mortgage Type
New Conventional
Purchase Details
Closed on
Jan 13, 2006
Sold by
Wes Johnson Construction Inc
Bought by
Sanchez John and Sanchez Julee
Home Financials for this Owner
Home Financials are based on the most recent Mortgage that was taken out on this home.
Original Mortgage
$1,600
Interest Rate
6.28%
Mortgage Type
Unknown
Create a Home Valuation Report for This Property
The Home Valuation Report is an in-depth analysis detailing your home's value as well as a comparison with similar homes in the area
Home Values in the Area
Average Home Value in this Area
Purchase History
| Date | Buyer | Sale Price | Title Company |
|---|---|---|---|
| Hamblin Kristin | -- | Pinnacle Title | |
| Hamblin Gary Ray | -- | Northern Title Company | |
| Sanchez John | -- | Hickman Land Title Company | |
| Wes Johnson Construction Inc | -- | Hickman Land Title Company |
Source: Public Records
Mortgage History
| Date | Status | Borrower | Loan Amount |
|---|---|---|---|
| Open | Hamblin Kristin | $130,000 | |
| Closed | Hamblin Gary Ray | $177,450 | |
| Previous Owner | Sanchez John | $1,600 | |
| Previous Owner | Wes Johnson Construction Inc | $1,600 | |
| Previous Owner | Sanchez John | $145,713 |
Source: Public Records
Tax History Compared to Growth
Tax History
| Year | Tax Paid | Tax Assessment Tax Assessment Total Assessment is a certain percentage of the fair market value that is determined by local assessors to be the total taxable value of land and additions on the property. | Land | Improvement |
|---|---|---|---|---|
| 2025 | $2,150 | $278,115 | $0 | $0 |
| 2024 | $2,226 | $278,890 | $0 | $0 |
| 2023 | $2,311 | $275,910 | $0 | $0 |
| 2022 | $2,179 | $242,905 | $0 | $0 |
| 2021 | $2,109 | $363,320 | $50,000 | $313,320 |
| 2020 | $1,707 | $264,671 | $50,000 | $214,671 |
| 2019 | $1,784 | $264,670 | $50,000 | $214,670 |
| 2018 | $1,748 | $236,670 | $50,000 | $186,670 |
| 2017 | $1,611 | $115,335 | $0 | $0 |
| 2016 | $1,670 | $100,815 | $0 | $0 |
| 2015 | $1,432 | $98,810 | $0 | $0 |
| 2014 | $1,295 | $98,810 | $0 | $0 |
| 2013 | -- | $98,810 | $0 | $0 |
Source: Public Records
Map
Nearby Homes
- 1206 S 900 W
- 736 Majestic Dr
- 985 W 720 S
- 420 S 1400 W
- 553 Center Ave
- 1220 W 575 S
- 501 Southwest St
- 548 S 1225 W Unit 115
- 542 S 1225 W Unit 116
- 1239 W 575 S Unit 152
- 1239 W 575 S
- 658 W 500 S
- 518 S 1225 W
- 506 S 1225 W
- 2399 W 430 S Unit 33
- Hemlock Plan at Sugar Creek - Logan
- Eucalyptus Plan at Sugar Creek - Logan
- Blackberry Plan at Sugar Creek - Logan
- Magnolia Plan at Sugar Creek - Logan
- 1227 W 500 S Unit 151
- 1024 Southgate Ct
- 988 W 1000 S
- 1006 Southgate Ct
- 1038 Southgate Ct
- 1046 Southgate Ct Unit 5
- 1046 Southgate Ct
- 994 W 1000 S
- 1047 Southgate Ct
- 1019 S 900 W
- 1027 S 900 W
- 1037 S 900 W
- 912 W 1000 S
- 1062 Southgate Ct
- 980 W 1000 S
- 1048 S 1000 W
- 1061 Southgate Ct
- 1041 S 900 W
- 1080 Southgate Ct
- 1062 S 1000 W
- 1049 S 900 W