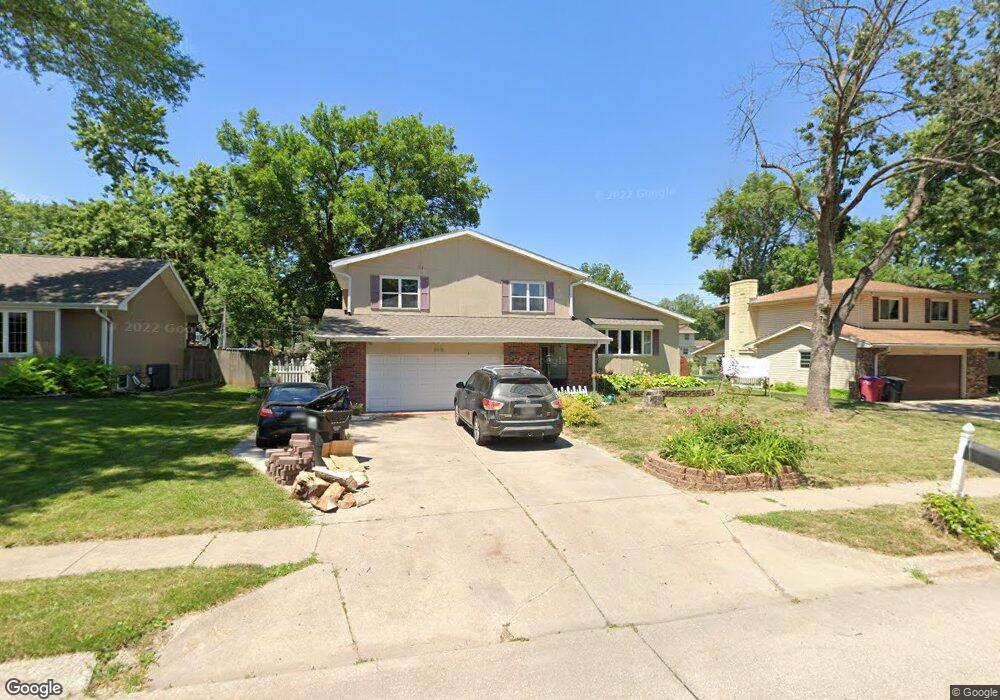
1012 Suzanne Ave Papillion, NE 68046
Estimated Value: $303,000 - $341,000
4
Beds
3
Baths
2,144
Sq Ft
$149/Sq Ft
Est. Value
About This Home
This home is located at 1012 Suzanne Ave, Papillion, NE 68046 and is currently estimated at $320,046, approximately $149 per square foot. 1012 Suzanne Ave is a home located in Sarpy County with nearby schools including Carriage Hill Elementary School, Papillion Middle School, and Papillion La Vista South High School.
Ownership History
Date
Name
Owned For
Owner Type
Purchase Details
Closed on
May 16, 2013
Sold by
Hellbusch Joyce I
Bought by
Croson Kathleen J and Harlow Kevin W
Current Estimated Value
Home Financials for this Owner
Home Financials are based on the most recent Mortgage that was taken out on this home.
Original Mortgage
$82,400
Outstanding Balance
$17,923
Interest Rate
3.45%
Mortgage Type
New Conventional
Estimated Equity
$302,123
Purchase Details
Closed on
May 16, 2000
Sold by
Altergott Bernard R and Altergott Suzanne M
Bought by
Hellbusch Donald E and Hellbusch Joyce I
Purchase Details
Closed on
Jul 23, 1998
Sold by
Norris Kenneth W and Norris Bertha M
Bought by
Altergott Bernard R and Altergott Suzanne M
Home Financials for this Owner
Home Financials are based on the most recent Mortgage that was taken out on this home.
Original Mortgage
$125,950
Interest Rate
6.94%
Mortgage Type
VA
Create a Home Valuation Report for This Property
The Home Valuation Report is an in-depth analysis detailing your home's value as well as a comparison with similar homes in the area
Home Values in the Area
Average Home Value in this Area
Purchase History
| Date | Buyer | Sale Price | Title Company |
|---|---|---|---|
| Croson Kathleen J | -- | Nebraska Title Company O | |
| Hellbusch Donald E | $123,000 | -- | |
| Altergott Bernard R | $124,000 | Dakota Title & Escrow Co |
Source: Public Records
Mortgage History
| Date | Status | Borrower | Loan Amount |
|---|---|---|---|
| Open | Croson Kathleen J | $82,400 | |
| Previous Owner | Altergott Bernard R | $125,950 |
Source: Public Records
Tax History
| Year | Tax Paid | Tax Assessment Tax Assessment Total Assessment is a certain percentage of the fair market value that is determined by local assessors to be the total taxable value of land and additions on the property. | Land | Improvement |
|---|---|---|---|---|
| 2025 | $4,432 | $322,840 | $45,000 | $277,840 |
| 2024 | $5,251 | $298,171 | $40,000 | $258,171 |
| 2023 | $5,251 | $278,865 | $40,000 | $238,865 |
| 2022 | $4,966 | $243,340 | $35,000 | $208,340 |
| 2021 | $4,478 | $215,113 | $30,000 | $185,113 |
| 2020 | $4,451 | $211,657 | $29,000 | $182,657 |
| 2019 | $4,296 | $204,443 | $29,000 | $175,443 |
| 2018 | $4,155 | $194,704 | $22,000 | $172,704 |
| 2017 | $3,485 | $163,373 | $22,000 | $141,373 |
| 2016 | $3,417 | $160,409 | $22,000 | $138,409 |
| 2015 | $3,248 | $152,910 | $22,000 | $130,910 |
| 2014 | $3,335 | $155,962 | $22,000 | $133,962 |
| 2012 | -- | $155,858 | $22,000 | $133,858 |
Source: Public Records
Map
Nearby Homes
- 1114 Hackney Dr
- 1113 Hackney Dr
- 921 Arlene Cir
- 1015 Patricia Dr
- 1013 Patricia Dr
- 1107 Patricia Dr
- 1021 Patricia Dr
- 1101 Patricia Dr
- 1005 Patricia Dr
- 1009 Patricia Dr
- 1103 Patricia Dr
- 1017 Patricia Dr
- 1019 Patricia Dr
- 1023 Patricia Dr
- 1011 Patricia Dr
- 1003 Patricia Dr
- 1007 Patricia Dr
- 1001 Patricia Dr
- 1120 Delmar St Unit 4B
- 1120 Delmar St Unit 5B
- 1010 Suzanne Ave
- 1014 Suzanne Ave
- 807 Arlene Ave
- 1008 Suzanne Ave
- 1016 Suzanne Ave
- 809 Monarch Cir
- 806 Crest Dr
- 811 Monarch Cir
- 712 Crest Dr
- 808 Arlene Ave
- 1006 Suzanne Ave
- 809 Arlene Ave
- 807 Monarch Cir
- 808 Crest Dr
- 810 Arlene Ave
- 710 Crest Dr
- 1004 Suzanne Ave
- 805 Monarch Cir
- 801 Crest Dr
- 811 Arlene Ave
Your Personal Tour Guide
Ask me questions while you tour the home.