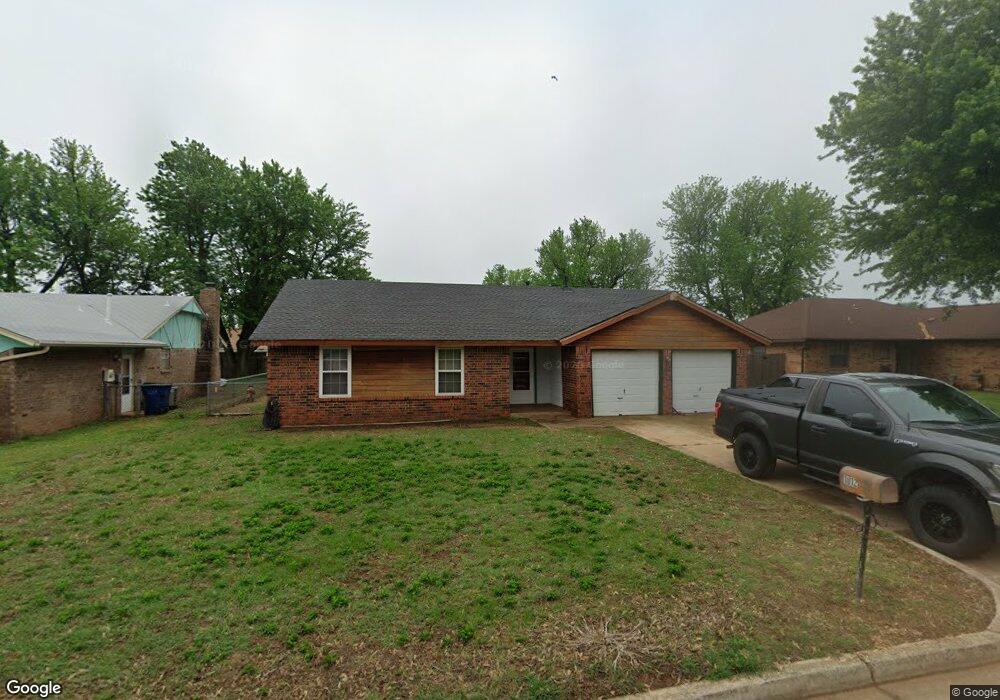
1012 W Johnathan Way Mustang, OK 73064
Estimated Value: $173,343 - $217,000
3
Beds
2
Baths
1,310
Sq Ft
$149/Sq Ft
Est. Value
About This Home
This home is located at 1012 W Johnathan Way, Mustang, OK 73064 and is currently estimated at $195,836, approximately $149 per square foot. 1012 W Johnathan Way is a home located in Canadian County with nearby schools including Mustang Lakehoma Elementary School, Mustang Horizon Intermediate School, and Mustang Middle School.
Ownership History
Date
Name
Owned For
Owner Type
Purchase Details
Closed on
Nov 20, 2024
Sold by
Lumen Linda B
Bought by
Lumen Linda B and Roberts Brian Edward
Current Estimated Value
Purchase Details
Closed on
Dec 29, 2022
Sold by
Lumen Linda B
Bought by
Lumen Linda B and Roberts Brian Edward
Purchase Details
Closed on
Oct 3, 2011
Sold by
Lumen Linda B
Bought by
Lumen Linda B and Linda B Lumen Revocable Trust
Purchase Details
Closed on
Sep 3, 2004
Sold by
Mashaney Chris H and Mashaney Michelle
Home Financials for this Owner
Home Financials are based on the most recent Mortgage that was taken out on this home.
Original Mortgage
$92,995
Interest Rate
6.08%
Purchase Details
Closed on
Apr 15, 1997
Sold by
Chisholm James R and Chisholm Rasonda L
Purchase Details
Closed on
May 30, 1995
Sold by
Noyes Bobby W
Purchase Details
Closed on
Jul 15, 1994
Sold by
Mattingly Michael W and Mattingly Stacy L
Purchase Details
Closed on
Nov 27, 1990
Create a Home Valuation Report for This Property
The Home Valuation Report is an in-depth analysis detailing your home's value as well as a comparison with similar homes in the area
Home Values in the Area
Average Home Value in this Area
Purchase History
| Date | Buyer | Sale Price | Title Company |
|---|---|---|---|
| Lumen Linda B | -- | None Listed On Document | |
| Lumen Linda B | -- | None Listed On Document | |
| Lumen Linda B | -- | None Listed On Document | |
| Lumen Linda B | -- | -- | |
| Lumen Linda B | -- | None Available | |
| -- | $94,000 | -- | |
| -- | $61,000 | -- | |
| -- | $63,000 | -- | |
| -- | $61,800 | -- | |
| -- | $57,000 | -- |
Source: Public Records
Mortgage History
| Date | Status | Borrower | Loan Amount |
|---|---|---|---|
| Previous Owner | -- | $92,995 |
Source: Public Records
Tax History Compared to Growth
Tax History
| Year | Tax Paid | Tax Assessment Tax Assessment Total Assessment is a certain percentage of the fair market value that is determined by local assessors to be the total taxable value of land and additions on the property. | Land | Improvement |
|---|---|---|---|---|
| 2024 | $954 | $10,922 | $839 | $10,083 |
| 2023 | $954 | $10,563 | $1,006 | $9,557 |
| 2022 | $966 | $10,563 | $1,166 | $9,397 |
| 2021 | $969 | $10,563 | $1,416 | $9,147 |
| 2020 | $975 | $10,563 | $1,400 | $9,163 |
| 2019 | $976 | $10,563 | $1,432 | $9,131 |
| 2018 | $997 | $10,562 | $1,687 | $8,875 |
| 2017 | $985 | $10,563 | $1,589 | $8,974 |
| 2016 | $987 | $10,562 | $1,620 | $8,942 |
| 2015 | $1,040 | $10,563 | $1,800 | $8,763 |
| 2014 | $1,040 | $11,016 | $1,200 | $9,816 |
Source: Public Records
Map
Nearby Homes
- 500 N Remington Way
- 608 N Remington Way
- 0 N Czech Hall Rd
- 913 N Kirk Way
- 912 N Barn Hill Way
- 304 N Geronimo Way
- 601 N Chisholm Trail Way
- 313 N Shannon Way
- 805 W Old Farm Way
- 101 N Shannon Way
- 1308 W Harvard Way
- 557 W Pine Rose Court Way
- 1316 W Harvard Way
- 1250 N Tea Olive Way
- 534 W Pine Rose Court Way
- 531 W Shadow Ridge Way
- 1401 N Golden Bell Way
- 401 N Topaz Way
- 1401 W Harvard Way
- 1408 N Golden Bell Way
- 956 W Johnathan Way
- 1018 W Johnathan Way
- 950 W Johnathan Way
- 1011 W Churchill Way
- 955 W Churchill Way
- 1024 W Johnathan Way
- 1013 W Johnathan Way
- 1007 W Johnathan Way
- 1017 W Churchill Way
- 1019 W Johnathan Way
- 955 W Johnathan Way
- 949 W Churchill Way
- 944 W Johnathan Way
- 1023 W Churchill Way
- 949 W Johnathan Way
- 1030 W Johnathan Way
- 1025 W Johnathan Way
- 1025 W Johnathan Way
- 1025 W Johnathan Way
- 1025 W Johnathan Way