1012 W Liberty St Ann Arbor, MI 48103
Eberwhite NeighborhoodEstimated Value: $710,101 - $825,000
3
Beds
3
Baths
2,098
Sq Ft
$370/Sq Ft
Est. Value
About This Home
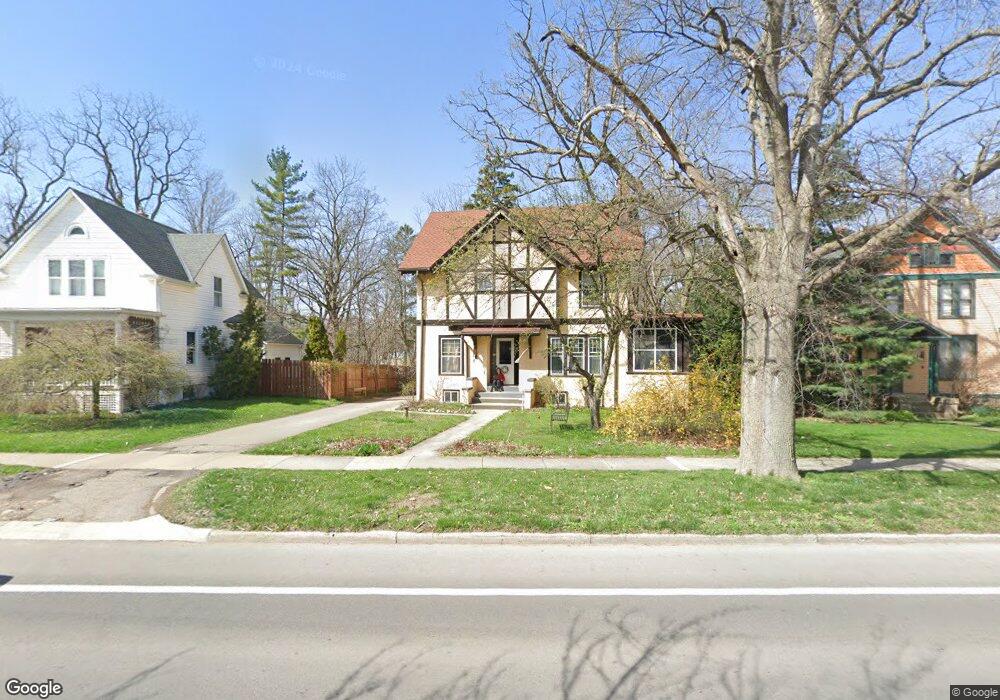
This home is located at 1012 W Liberty St, Ann Arbor, MI 48103 and is currently estimated at $775,775, approximately $369 per square foot. 1012 W Liberty St is a home located in Washtenaw County with nearby schools including Eberwhite Elementary School, Slauson Middle School, and Pioneer High School.
Ownership History
Date
Name
Owned For
Owner Type
Purchase Details
Closed on
Dec 14, 2020
Sold by
Cherney Anne C
Bought by
Cherney Anne C
Current Estimated Value
Purchase Details
Closed on
Sep 22, 2016
Sold by
Cherney Michael Dennis and Cherney Yarimar
Bought by
Blake David C and Blake Patricia A
Home Financials for this Owner
Home Financials are based on the most recent Mortgage that was taken out on this home.
Original Mortgage
$150,000
Interest Rate
3.43%
Mortgage Type
New Conventional
Purchase Details
Closed on
Feb 26, 2014
Sold by
Cherney Anne
Bought by
Cherney Michael Dennis and Cherney Yarimar
Home Financials for this Owner
Home Financials are based on the most recent Mortgage that was taken out on this home.
Original Mortgage
$100,000
Interest Rate
4.35%
Mortgage Type
Purchase Money Mortgage
Purchase Details
Closed on
Sep 4, 2006
Sold by
Cherney Dennis M and Cherney Anne
Bought by
Cherney Anne and Cherney Michael Dennis
Create a Home Valuation Report for This Property
The Home Valuation Report is an in-depth analysis detailing your home's value as well as a comparison with similar homes in the area
Home Values in the Area
Average Home Value in this Area
Purchase History
| Date | Buyer | Sale Price | Title Company |
|---|---|---|---|
| Cherney Anne C | -- | Mitzel Law Group Plc | |
| Blake David C | $187,500 | Liberty Title | |
| Cherney Michael Dennis | $100,000 | None Available | |
| Cherney Anne | $100,000 | None Available |
Source: Public Records
Mortgage History
| Date | Status | Borrower | Loan Amount |
|---|---|---|---|
| Previous Owner | Blake David C | $150,000 | |
| Previous Owner | Cherney Michael Dennis | $100,000 |
Source: Public Records
Tax History Compared to Growth
Tax History
| Year | Tax Paid | Tax Assessment Tax Assessment Total Assessment is a certain percentage of the fair market value that is determined by local assessors to be the total taxable value of land and additions on the property. | Land | Improvement |
|---|---|---|---|---|
| 2025 | $6,433 | $305,900 | $0 | $0 |
| 2024 | $6,274 | $282,600 | $0 | $0 |
| 2023 | $5,785 | $277,300 | $0 | $0 |
| 2022 | $6,304 | $245,500 | $0 | $0 |
| 2021 | $6,155 | $240,300 | $0 | $0 |
| 2020 | $6,031 | $230,700 | $0 | $0 |
| 2019 | $5,740 | $219,200 | $219,200 | $0 |
| 2018 | $5,659 | $209,000 | $0 | $0 |
| 2017 | $5,505 | $193,300 | $0 | $0 |
| 2016 | $5,311 | $110,077 | $0 | $0 |
| 2015 | $5,058 | $109,748 | $0 | $0 |
| 2014 | $5,058 | $106,319 | $0 | $0 |
| 2013 | -- | $106,319 | $0 | $0 |
Source: Public Records
Map
Nearby Homes
- 814 W Jefferson St
- 220 S 7th St
- 717 W Liberty St
- 285 Mulholland St Unit 3
- 410 S Revena Blvd
- 614 S 7th St
- 533 5th St
- 116 N 7th St
- 552 5th St
- 215 Bucholz Ct
- 404 W Liberty St
- 577 Glendale Cir
- 441 S Ashley St Unit 405
- 140 Ashley Mews Dr Unit 27
- 1812 Jackson Ave
- 220 W Mosley St
- 111 N Ashley St Unit 513
- 212 Miller Ave Unit 102
- 212 Miller Ave Unit 203
- 212 Miller Ave Unit 302
- 1008 W Liberty St
- 1026 W Liberty St
- 1002 W Liberty St
- 348 8th St
- 1028 W Liberty St
- 344 Eighth St
- 344 8th St
- 1017 W Liberty St
- 1009 W Liberty St
- 1005 W Liberty St
- 1033 W Liberty St
- 1034 W Liberty St
- 1003 W Liberty St
- 340 8th St
- 1013 W Liberty St
- 1036 W Liberty St
- 929 W Liberty St
- 929 W Liberty St Unit 2
- 929 W Liberty St Unit 1
- 920 W Liberty St