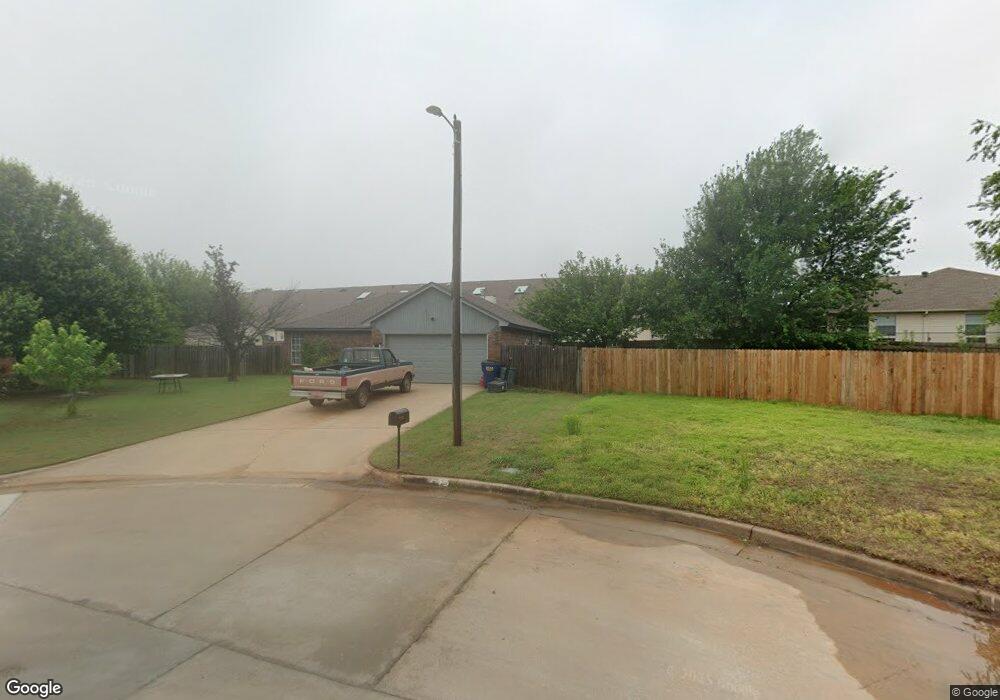
1012 W Tesio Way Mustang, OK 73064
Estimated Value: $171,000 - $186,000
3
Beds
2
Baths
1,058
Sq Ft
$170/Sq Ft
Est. Value
About This Home
This home is located at 1012 W Tesio Way, Mustang, OK 73064 and is currently estimated at $179,741, approximately $169 per square foot. 1012 W Tesio Way is a home located in Canadian County with nearby schools including Mustang Lakehoma Elementary School, Mustang Horizon Intermediate School, and Mustang Middle School.
Ownership History
Date
Name
Owned For
Owner Type
Purchase Details
Closed on
May 17, 2013
Sold by
Neely Barney and Neely Amanda
Bought by
Irby Mark F and Irby Kathy A
Current Estimated Value
Home Financials for this Owner
Home Financials are based on the most recent Mortgage that was taken out on this home.
Original Mortgage
$80,000
Outstanding Balance
$56,892
Interest Rate
3.56%
Mortgage Type
New Conventional
Estimated Equity
$122,849
Purchase Details
Closed on
Sep 22, 2006
Sold by
Robinson Lavona G and Kelly Gene
Bought by
Kelly Gene and Kelley Mary
Home Financials for this Owner
Home Financials are based on the most recent Mortgage that was taken out on this home.
Original Mortgage
$71,560
Interest Rate
8.25%
Mortgage Type
Adjustable Rate Mortgage/ARM
Purchase Details
Closed on
Sep 3, 2003
Sold by
Robinson Lavona G
Purchase Details
Closed on
Oct 21, 1993
Sold by
Owens Gary and Owens Terri
Purchase Details
Closed on
Jun 14, 1993
Sold by
Central Bank Of Okc
Purchase Details
Closed on
Sep 28, 1989
Create a Home Valuation Report for This Property
The Home Valuation Report is an in-depth analysis detailing your home's value as well as a comparison with similar homes in the area
Home Values in the Area
Average Home Value in this Area
Purchase History
| Date | Buyer | Sale Price | Title Company |
|---|---|---|---|
| Irby Mark F | $100,000 | Ort | |
| Kelly Gene | -- | Warranty Title & Abstract In | |
| -- | -- | -- | |
| -- | $51,300 | -- | |
| -- | $23,000 | -- | |
| -- | -- | -- |
Source: Public Records
Mortgage History
| Date | Status | Borrower | Loan Amount |
|---|---|---|---|
| Open | Irby Mark F | $80,000 | |
| Previous Owner | Kelly Gene | $71,560 |
Source: Public Records
Tax History Compared to Growth
Tax History
| Year | Tax Paid | Tax Assessment Tax Assessment Total Assessment is a certain percentage of the fair market value that is determined by local assessors to be the total taxable value of land and additions on the property. | Land | Improvement |
|---|---|---|---|---|
| 2024 | $1,385 | $14,572 | $1,800 | $12,772 |
| 2023 | $1,385 | $13,879 | $1,800 | $12,079 |
| 2022 | $1,335 | $13,218 | $1,800 | $11,418 |
| 2021 | $1,300 | $12,827 | $1,800 | $11,027 |
| 2020 | $1,285 | $12,599 | $1,800 | $10,799 |
| 2019 | $1,224 | $11,999 | $1,800 | $10,199 |
| 2018 | $1,191 | $11,428 | $1,800 | $9,628 |
| 2017 | $1,194 | $11,591 | $1,796 | $9,795 |
| 2016 | $1,140 | $11,158 | $1,800 | $9,358 |
| 2015 | $1,040 | $10,514 | $1,619 | $8,895 |
| 2014 | $1,040 | $10,013 | $1,200 | $8,813 |
Source: Public Records
Map
Nearby Homes
- 1035 W Windsor Way
- 508 N Caddell Way
- 608 N Remington Way
- 313 N Shannon Way
- 850 W Forest Dr
- 844 W Forest Dr
- 513 N Shannon Way
- 601 N Chisholm Trail Way
- 628 W Alamo Court Way
- 602 W Shadow Ridge Way
- 400 N Amethyst Way
- 531 W Shadow Ridge Way
- 401 N Topaz Way
- 309 N Topaz Way
- 1005 W Ridgehaven Way
- 520 S Owen Dr
- 635 W Hillcrest Dr
- 613 W Greenwood Ct
- 1308 W Harvard Way
- 1208 W Flowering Peach Way
- 1006 W Tesio Way
- 1017 W State Highway 152
- 1007 W Tesio Way
- 1000 W Tesio Way
- 1248 W State Highway 152
- 956 W Tesio Way
- 957 W Tesio Way
- 954 W Tesio Way
- 955 W Tesio Way
- 1036 W Windsor Way
- 1042 W Windsor Way
- 950 W Tesio Way
- 1030 W Windsor Way
- 951 W Tesio Way
- 1024 W Windsor Way
- 1048 W Windsor Way
- 948 W Tesio Way
- 949 W Tesio Way
- 1018 W Windsor Way
- 1106 W Windsor Way