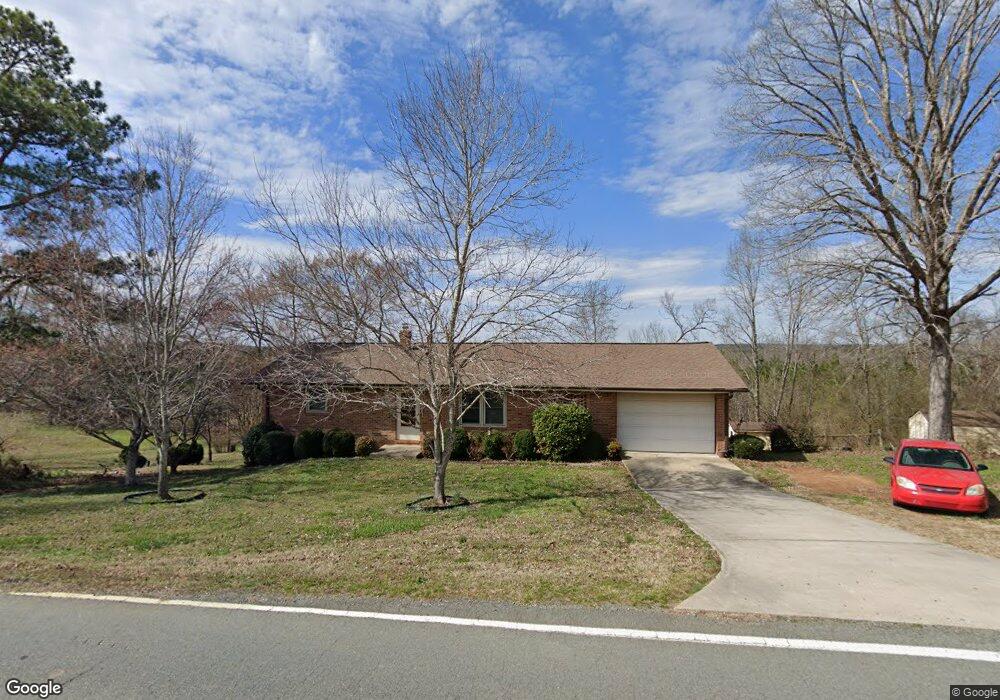
10120 Reed Mine Rd Midland, NC 28107
Estimated Value: $260,000 - $339,000
2
Beds
2
Baths
1,296
Sq Ft
$236/Sq Ft
Est. Value
About This Home
This home is located at 10120 Reed Mine Rd, Midland, NC 28107 and is currently estimated at $306,028, approximately $236 per square foot. 10120 Reed Mine Rd is a home located in Cabarrus County with nearby schools including Bethel Elementary School, C.C. Griffin Middle School, and Central Cabarrus High School.
Ownership History
Date
Name
Owned For
Owner Type
Purchase Details
Closed on
Jun 29, 2023
Sold by
Orlowski John J
Bought by
Orlowski John Michael
Current Estimated Value
Home Financials for this Owner
Home Financials are based on the most recent Mortgage that was taken out on this home.
Original Mortgage
$213,400
Outstanding Balance
$207,920
Interest Rate
6.39%
Mortgage Type
New Conventional
Estimated Equity
$98,108
Purchase Details
Closed on
Jun 17, 2021
Sold by
Cooke Charles Steven and Cooke Mary Beth
Bought by
Orlowski John J
Home Financials for this Owner
Home Financials are based on the most recent Mortgage that was taken out on this home.
Original Mortgage
$202,020
Interest Rate
2.9%
Mortgage Type
USDA
Purchase Details
Closed on
Nov 26, 2019
Sold by
Hudson Linda Biggers and Hudson John David
Bought by
Cooke Charles Steven
Purchase Details
Closed on
Jan 13, 1999
Sold by
Biggers Edna M
Bought by
Hudson Linda Biggers
Create a Home Valuation Report for This Property
The Home Valuation Report is an in-depth analysis detailing your home's value as well as a comparison with similar homes in the area
Home Values in the Area
Average Home Value in this Area
Purchase History
| Date | Buyer | Sale Price | Title Company |
|---|---|---|---|
| Orlowski John Michael | $220,000 | None Listed On Document | |
| Orlowski John J | $210,000 | None Available | |
| Cooke Charles Steven | $110,000 | None Available | |
| Hudson Linda Biggers | -- | -- |
Source: Public Records
Mortgage History
| Date | Status | Borrower | Loan Amount |
|---|---|---|---|
| Open | Orlowski John Michael | $213,400 | |
| Previous Owner | Orlowski John J | $202,020 |
Source: Public Records
Tax History Compared to Growth
Tax History
| Year | Tax Paid | Tax Assessment Tax Assessment Total Assessment is a certain percentage of the fair market value that is determined by local assessors to be the total taxable value of land and additions on the property. | Land | Improvement |
|---|---|---|---|---|
| 2025 | $1,803 | $270,770 | $55,120 | $215,650 |
| 2024 | $1,803 | $270,770 | $55,120 | $215,650 |
| 2023 | $1,136 | $136,520 | $27,560 | $108,960 |
| 2022 | $1,136 | $136,570 | $27,610 | $108,960 |
| 2021 | $1,136 | $136,570 | $27,610 | $108,960 |
| 2020 | $1,092 | $131,260 | $27,610 | $103,650 |
| 2019 | $1,063 | $127,730 | $35,890 | $91,840 |
| 2018 | $1,037 | $127,730 | $35,890 | $91,840 |
| 2017 | $1,012 | $127,730 | $35,890 | $91,840 |
| 2016 | $1,012 | $116,980 | $30,370 | $86,610 |
| 2015 | $920 | $116,980 | $30,370 | $86,610 |
| 2014 | $920 | $116,980 | $30,370 | $86,610 |
Source: Public Records
Map
Nearby Homes
- 10130 Reed Mine Rd
- 10791 Hartsell Rd
- 6827 England Rd
- 11732 Glenwood Dr
- 11788 Glenwood Dr Unit 56
- 10620 U S 601
- 4207 Amanda Dr
- 6168 Busch Way
- The Benson II Plan at Pine Bluff
- The McGinnis Plan at Pine Bluff
- The James Plan at Pine Bluff
- The Langford Plan at Pine Bluff
- The Lancaster Plan at Pine Bluff
- The Harrington Plan at Pine Bluff
- The Phoenix Plan at Pine Bluff
- The Avery Plan at Pine Bluff
- The Coleman Plan at Pine Bluff
- 11060 Teresia Ln
- 6308 Honor Ave
- 6336 Busch Way
- 0 Hartsell Rd
- 00 Hartsell Rd
- 10111 Reed Mine Rd
- Lot 2 Reed Mine Rd
- Lot 2 Reed Mine Rd Unit Lot 2
- 10180 Reed Mine Rd
- Lot 4 Reed Mine Rd
- Lot 4 Reed Mine Rd Unit LOt 4
- 10175 Reed Mine Rd
- 10201 Reed Mine Rd
- 10201 Reed Mine Rd Unit 5
- Lot 5 Reed Mine Rd
- Lot 5 Reed Mine Rd Unit Lot 5
- 10225 Hartsell Rd
- 10075 Reed Mine Rd Unit 1
- 10275 Hartsell Rd
- 10256 Hartsell Rd
- 10361 Reed Mine Rd
- 10276 Hartsell Rd
- 10420 Reed Mine Rd