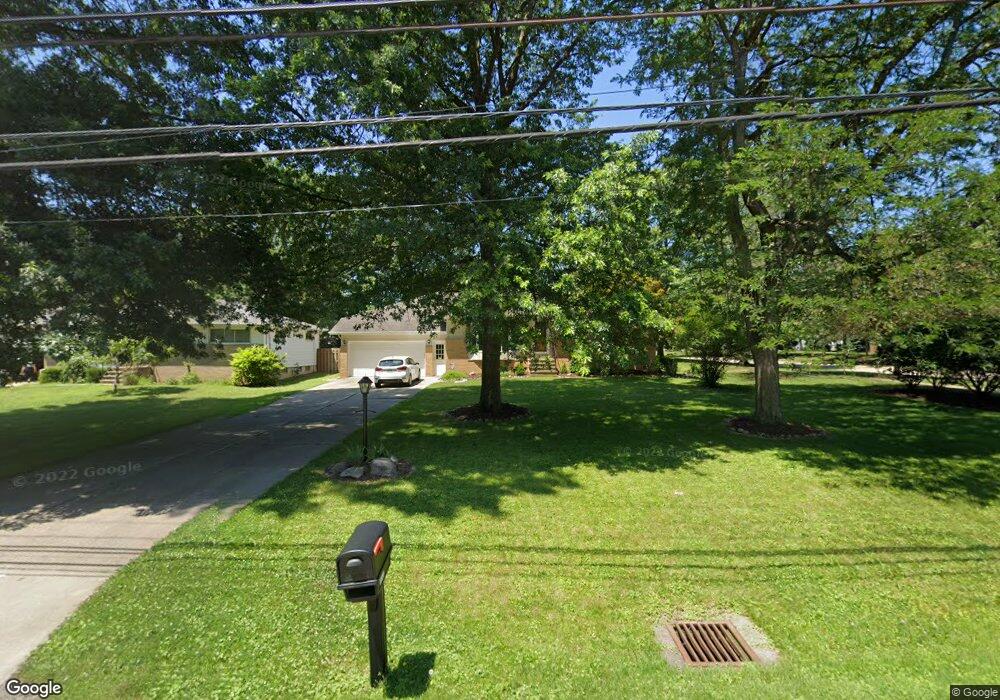
10122 Webster Rd Strongsville, OH 44136
Estimated Value: $303,000 - $363,000
3
Beds
2
Baths
2,459
Sq Ft
$135/Sq Ft
Est. Value
About This Home
This home is located at 10122 Webster Rd, Strongsville, OH 44136 and is currently estimated at $332,643, approximately $135 per square foot. 10122 Webster Rd is a home located in Cuyahoga County with nearby schools including Strongsville High School, The Academy of St. Bartholomew, and Royal Redeemer Lutheran School.
Ownership History
Date
Name
Owned For
Owner Type
Purchase Details
Closed on
Jun 25, 2002
Sold by
Engelman Kathy E and Livingston Kathy E
Bought by
Livingston Michael and Livingston Kathy E
Current Estimated Value
Home Financials for this Owner
Home Financials are based on the most recent Mortgage that was taken out on this home.
Original Mortgage
$138,000
Interest Rate
6.91%
Purchase Details
Closed on
Mar 15, 1996
Sold by
Suglio Jeffrey
Bought by
Engelman Kathy E
Home Financials for this Owner
Home Financials are based on the most recent Mortgage that was taken out on this home.
Original Mortgage
$100,000
Interest Rate
8.2%
Mortgage Type
New Conventional
Purchase Details
Closed on
Sep 29, 1988
Sold by
Biascsi Joseph C and Biascsi Marie C
Bought by
Suglio Jeffrey
Purchase Details
Closed on
May 28, 1986
Sold by
Biasci Joseph C and Biasci Marie C
Bought by
Biascsi Joseph C and Biascsi Marie C
Purchase Details
Closed on
Jan 1, 1975
Bought by
Biasci Joseph C and Biasci Marie C
Create a Home Valuation Report for This Property
The Home Valuation Report is an in-depth analysis detailing your home's value as well as a comparison with similar homes in the area
Home Values in the Area
Average Home Value in this Area
Purchase History
| Date | Buyer | Sale Price | Title Company |
|---|---|---|---|
| Livingston Michael | -- | -- | |
| Engelman Kathy E | $125,000 | -- | |
| Suglio Jeffrey | $89,900 | -- | |
| Biascsi Joseph C | -- | -- | |
| Biasci Joseph C | -- | -- |
Source: Public Records
Mortgage History
| Date | Status | Borrower | Loan Amount |
|---|---|---|---|
| Previous Owner | Livingston Michael | $138,000 | |
| Previous Owner | Engelman Kathy E | $100,000 |
Source: Public Records
Tax History Compared to Growth
Tax History
| Year | Tax Paid | Tax Assessment Tax Assessment Total Assessment is a certain percentage of the fair market value that is determined by local assessors to be the total taxable value of land and additions on the property. | Land | Improvement |
|---|---|---|---|---|
| 2024 | $4,468 | $95,165 | $11,515 | $83,650 |
| 2023 | $4,726 | $75,470 | $15,860 | $59,610 |
| 2022 | $4,691 | $75,460 | $15,855 | $59,605 |
| 2021 | $4,654 | $75,460 | $15,860 | $59,610 |
| 2020 | $4,422 | $63,420 | $13,340 | $50,090 |
| 2019 | $4,292 | $181,200 | $38,100 | $143,100 |
| 2018 | $3,970 | $63,420 | $13,340 | $50,090 |
| 2017 | $4,119 | $62,090 | $10,500 | $51,590 |
| 2016 | $4,085 | $62,090 | $10,500 | $51,590 |
| 2015 | $4,022 | $62,090 | $10,500 | $51,590 |
| 2014 | $4,022 | $60,280 | $10,190 | $50,090 |
Source: Public Records
Map
Nearby Homes
- 10010 Chevy Chase
- 9890 Webster Rd
- 9834 Brookline Oval
- 9531 Nicole Cir
- 10266 Huntington Park Dr
- 14069 Basswood Cir
- 15485 Albion Rd
- 9129 Tahoe Cir
- 10560 Stapleton Dr
- Buchanan Plan at The Enclave at Pine Lakes Crossing
- Belleville Plan at The Enclave at Pine Lakes Crossing
- 10664 Scottsdale Dr
- 14409 Glenbrook Dr
- 9286 Rainier Ct
- 14584 Baywood Ln
- 14557 Baywood Ln
- 14644 Baywood Ln
- 15222 High Point
- 13861 Woodhawk Dr
- 13740 Glenbrook Dr
- 10164 Webster Rd
- 10204 Webster Rd
- 10107 Versailles Dr
- 10123 Versailles Dr
- 9980 Webster Rd
- 10139 Versailles Dr
- 10033 Webster Rd
- 10256 Webster Rd
- 10119 Webster Rd
- 10075 Webster Rd
- 9947 Chevy Chase
- 10155 Versailles Dr
- 10029 Webster Rd
- 9915 Chevy Chase
- 10120 Versailles Dr
- 9979 Chevy Chase
- 10298 Webster Rd
- 10171 Versailles Dr
- 10152 Versailles Dr
- 10205 Webster Rd