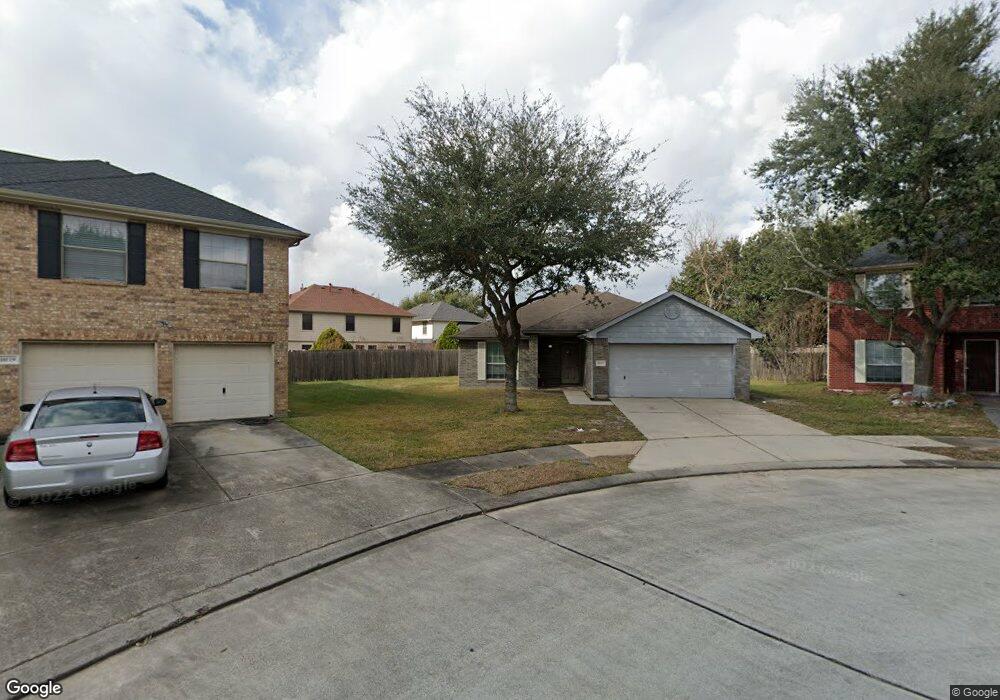
10123 Fallmont Ct Houston, TX 77086
North Houston NeighborhoodEstimated Value: $221,242 - $256,000
3
Beds
2
Baths
1,630
Sq Ft
$145/Sq Ft
Est. Value
About This Home
This home is located at 10123 Fallmont Ct, Houston, TX 77086 and is currently estimated at $236,061, approximately $144 per square foot. 10123 Fallmont Ct is a home located in Harris County with nearby schools including Kujawa EC/Pre-K/K School, Wilson Intermediate School, and Shotwell Middle School.
Ownership History
Date
Name
Owned For
Owner Type
Purchase Details
Closed on
Jul 1, 2025
Sold by
Williams Krisanthia
Bought by
Williams Jamarcus
Current Estimated Value
Purchase Details
Closed on
Mar 31, 2006
Sold by
Kb Home Mortgages Co
Bought by
Williams Jamarcus M
Home Financials for this Owner
Home Financials are based on the most recent Mortgage that was taken out on this home.
Original Mortgage
$22,800
Interest Rate
6.22%
Mortgage Type
Stand Alone Second
Purchase Details
Closed on
Jun 7, 2005
Sold by
Clark James E
Bought by
Kb Home Mortgage Co
Purchase Details
Closed on
Sep 5, 2002
Sold by
Kb Home Lone Star Lp
Bought by
Clark James E
Home Financials for this Owner
Home Financials are based on the most recent Mortgage that was taken out on this home.
Original Mortgage
$135,461
Interest Rate
6.25%
Mortgage Type
FHA
Create a Home Valuation Report for This Property
The Home Valuation Report is an in-depth analysis detailing your home's value as well as a comparison with similar homes in the area
Home Values in the Area
Average Home Value in this Area
Purchase History
| Date | Buyer | Sale Price | Title Company |
|---|---|---|---|
| Williams Jamarcus | -- | None Listed On Document | |
| Williams Jamarcus M | -- | Stewart Title Houston Div | |
| Kb Home Mortgage Co | $163,111 | -- | |
| Clark James E | -- | First American Title |
Source: Public Records
Mortgage History
| Date | Status | Borrower | Loan Amount |
|---|---|---|---|
| Previous Owner | Williams Jamarcus M | $22,800 | |
| Previous Owner | Williams Jamarcus M | $91,200 | |
| Previous Owner | Clark James E | $135,461 |
Source: Public Records
Tax History Compared to Growth
Tax History
| Year | Tax Paid | Tax Assessment Tax Assessment Total Assessment is a certain percentage of the fair market value that is determined by local assessors to be the total taxable value of land and additions on the property. | Land | Improvement |
|---|---|---|---|---|
| 2025 | $4,475 | $244,712 | $42,058 | $202,654 |
| 2024 | $4,475 | $231,298 | $42,058 | $189,240 |
| 2023 | $4,475 | $235,782 | $42,871 | $192,911 |
| 2022 | $4,566 | $187,595 | $32,978 | $154,617 |
| 2021 | $3,780 | $155,662 | $32,978 | $122,684 |
| 2020 | $4,360 | $161,489 | $32,978 | $128,511 |
| 2019 | $4,239 | $151,032 | $23,084 | $127,948 |
| 2018 | $1,941 | $135,145 | $23,084 | $112,061 |
| 2017 | $3,658 | $135,145 | $23,084 | $112,061 |
| 2016 | $3,470 | $128,203 | $23,084 | $105,119 |
| 2015 | $922 | $115,323 | $23,084 | $92,239 |
| 2014 | $922 | $97,613 | $23,084 | $74,529 |
Source: Public Records
Map
Nearby Homes
- 5914 Stirring Winds Ln
- 10730 Antoine Dr
- 3265 Frick Rd
- 6411 Halstead Meadows Cir
- 12623 Ann Louise Rd
- 00 Essie Rd
- 10214 Trade Winds Dr
- 3127 Frick Rd
- 6606 Dusty Dawn Dr
- 6706 Redding Springs Ln
- 6622 Sutton Meadows Dr
- 6703 Deer Ridge Ln
- 10306 Jillana Kaye Dr
- 13308 Ann Louise Rd
- 00 Romona Blvd
- 6830 Desert Rose Ln
- 13518 Kaltenbrun Rd
- 6502 Trail Valley Way
- 0 Tomball Pkwy
- 6822 Dusty Dawn Dr
- 10127 Fallmont Ct
- 10119 Fallmont Ct
- 10126 Country Knoll Dr
- 10130 Country Knoll Dr
- 10122 Country Knoll Dr
- 10115 Fallmont Ct
- 10118 Country Knoll Dr
- 10122 Fallmont Ct
- 10111 Fallmont Ct
- 10114 Country Knoll Dr
- 10118 Fallmont Ct
- 10114 Fallmont Ct
- 10110 Fallmont Ct
- 10110 Country Knoll Dr
- 10107 Fallmont Ct
- 5939 NW Creek Cir
- 5935 NW Creek Cir
- 5943 NW Creek Cir
- 10106 Fallmont Ct
- 10127 Country Knoll Dr