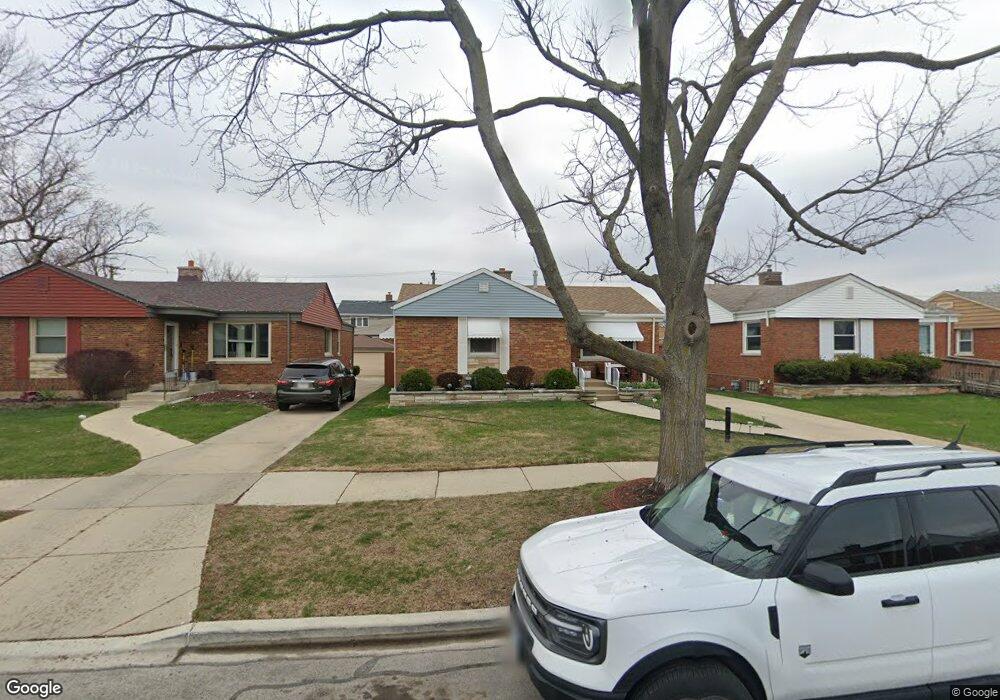
10126 Cambridge St Westchester, IL 60154
Estimated Value: $321,906 - $356,000
3
Beds
1
Bath
1,112
Sq Ft
$308/Sq Ft
Est. Value
About This Home
This home is located at 10126 Cambridge St, Westchester, IL 60154 and is currently estimated at $342,477, approximately $307 per square foot. 10126 Cambridge St is a home located in Cook County with nearby schools including Westchester Primary School, Westchester Intermediate School, and Westchester Middle School.
Ownership History
Date
Name
Owned For
Owner Type
Purchase Details
Closed on
Apr 19, 2022
Sold by
Perez Jose A and Perez Lucia
Bought by
Chicago Title Land Trust Co
Current Estimated Value
Purchase Details
Closed on
Apr 12, 2022
Sold by
Perez Jose A and Perez Lucia
Bought by
Chicago Title Land Trust Company
Purchase Details
Closed on
Aug 26, 2002
Sold by
Spears Reggie
Bought by
Perez Jose A
Home Financials for this Owner
Home Financials are based on the most recent Mortgage that was taken out on this home.
Original Mortgage
$122,000
Interest Rate
6.41%
Mortgage Type
Stand Alone First
Purchase Details
Closed on
Feb 12, 1997
Sold by
Schultz Harold W and Schultz Janet R
Bought by
Spears Reggie
Home Financials for this Owner
Home Financials are based on the most recent Mortgage that was taken out on this home.
Original Mortgage
$141,550
Interest Rate
7.92%
Create a Home Valuation Report for This Property
The Home Valuation Report is an in-depth analysis detailing your home's value as well as a comparison with similar homes in the area
Home Values in the Area
Average Home Value in this Area
Purchase History
| Date | Buyer | Sale Price | Title Company |
|---|---|---|---|
| Chicago Title Land Trust Co | -- | -- | |
| Chicago Title Land Trust Company | -- | Chicago Title | |
| Chicago Title Land Trust Co | -- | -- | |
| Perez Jose A | $236,000 | -- | |
| Spears Reggie | $149,000 | -- |
Source: Public Records
Mortgage History
| Date | Status | Borrower | Loan Amount |
|---|---|---|---|
| Previous Owner | Perez Jose A | $122,000 | |
| Previous Owner | Spears Reggie | $141,550 |
Source: Public Records
Tax History Compared to Growth
Tax History
| Year | Tax Paid | Tax Assessment Tax Assessment Total Assessment is a certain percentage of the fair market value that is determined by local assessors to be the total taxable value of land and additions on the property. | Land | Improvement |
|---|---|---|---|---|
| 2024 | $4,208 | $22,000 | $4,725 | $17,275 |
| 2023 | $4,254 | $22,000 | $4,725 | $17,275 |
| 2022 | $4,254 | $20,101 | $4,050 | $16,051 |
| 2021 | $4,166 | $20,101 | $4,050 | $16,051 |
| 2020 | $4,189 | $20,101 | $4,050 | $16,051 |
| 2019 | $4,016 | $20,390 | $3,712 | $16,678 |
| 2018 | $3,961 | $20,390 | $3,712 | $16,678 |
| 2017 | $2,806 | $20,390 | $3,712 | $16,678 |
| 2016 | $3,788 | $17,268 | $3,375 | $13,893 |
| 2015 | $3,677 | $17,268 | $3,375 | $13,893 |
| 2014 | $3,618 | $17,268 | $3,375 | $13,893 |
| 2013 | $3,763 | $19,477 | $3,375 | $16,102 |
Source: Public Records
Map
Nearby Homes
- 10072 Drury Ln
- 1119 Newcastle Ave
- 1247 S Mannheim Rd Unit 3
- 920 Suffolk Ave
- 1500 Bristol Ave
- 814 Norfolk Ave
- 923 Manchester Ave
- 805 Norfolk Ave
- 723 Balmoral Ave
- 10524 Camelot St
- 10531 Camelot St
- 1623 Manchester Ave
- 1601 Bristol Ave
- 750 Bristol Ave
- 626 Manchester Ave
- 1816 Manchester Ave
- 1136 Park Place
- 10567 Waterford Dr
- 1907 Suffolk Ave
- 1932 Newcastle Ave
- 10130 Cambridge St
- 10122 Cambridge St
- 10116 Cambridge St
- 10136 Cambridge St
- 10129 Pelham St
- 10123 Pelham St
- 10131 Pelham St
- 10140 Cambridge St
- 10112 Cambridge St
- 10119 Pelham St
- 10137 Pelham St
- 1301 Hull Ave
- 1300 Hull Ave
- 10115 Pelham St
- 10106 Cambridge St
- 10141 Pelham St
- 1307 Hull Ave
- 1255 Westchester Blvd
- 1255 Westchester Blvd
- 1306 Hull Ave