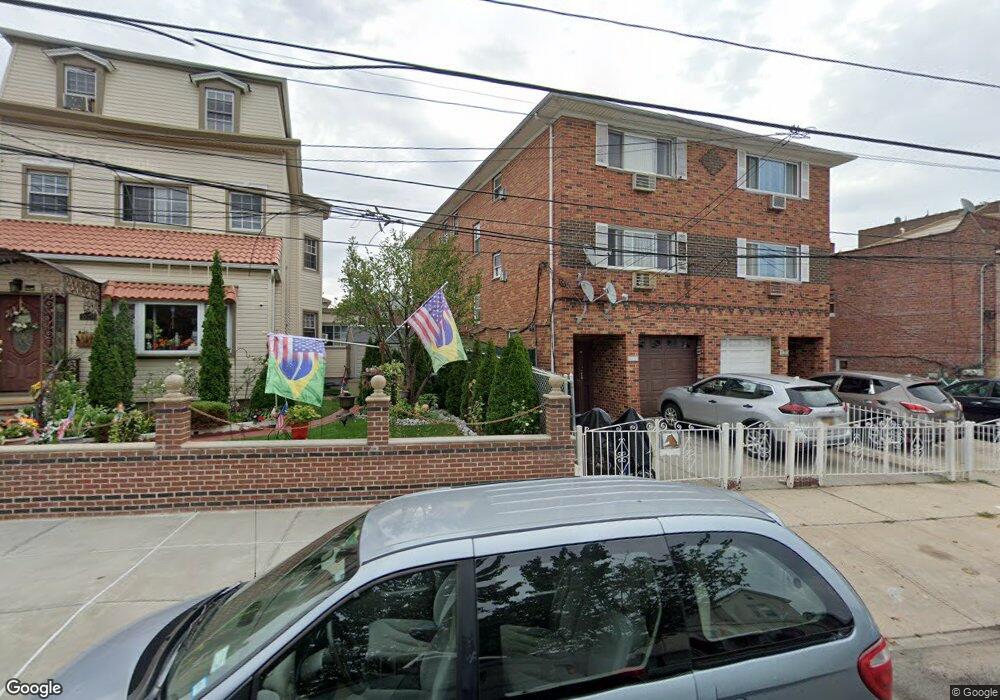
10127 95th St Ozone Park, NY 11416
Ozone Park NeighborhoodEstimated Value: $1,257,011 - $1,377,000
--
Bed
--
Bath
3,120
Sq Ft
$429/Sq Ft
Est. Value
About This Home
This home is located at 10127 95th St, Ozone Park, NY 11416 and is currently estimated at $1,339,503, approximately $429 per square foot. 10127 95th St is a home located in Queens County with nearby schools including P.S. 65 - The Raymond York Elementary School, Robert H. Goddard High School, and Divine Mercy Catholic Academy.
Ownership History
Date
Name
Owned For
Owner Type
Purchase Details
Closed on
Feb 15, 2023
Sold by
Cen Alberto and Cen Su Xiang
Bought by
Cen Alberto and Wu Carlos Cen
Current Estimated Value
Purchase Details
Closed on
Apr 4, 2011
Sold by
Degianni Giulia
Bought by
Cen Su Xiang and Cen Suxiang
Purchase Details
Closed on
May 20, 2010
Sold by
Degianni Antonio and Degianni Giulia
Bought by
Degianni Giulia
Purchase Details
Closed on
Oct 28, 2008
Sold by
Degianni Antonio and Degianni Giulia
Bought by
Curreri Maria and Degianni Leonardo
Purchase Details
Closed on
Mar 27, 1995
Sold by
Kolcz Jan and Kolcz Alfreda
Bought by
Degianni Antonio and Degianni Giulia
Home Financials for this Owner
Home Financials are based on the most recent Mortgage that was taken out on this home.
Original Mortgage
$115,000
Interest Rate
8.55%
Create a Home Valuation Report for This Property
The Home Valuation Report is an in-depth analysis detailing your home's value as well as a comparison with similar homes in the area
Home Values in the Area
Average Home Value in this Area
Purchase History
| Date | Buyer | Sale Price | Title Company |
|---|---|---|---|
| Cen Alberto | -- | -- | |
| Cen Su Xiang | $680,000 | -- | |
| Degianni Giulia | -- | -- | |
| Degianni Antonio | -- | -- | |
| Curreri Maria | -- | -- | |
| Curreri Maria | -- | -- | |
| Degianni Antonio | $255,000 | Chicago Title Insurance Co |
Source: Public Records
Mortgage History
| Date | Status | Borrower | Loan Amount |
|---|---|---|---|
| Previous Owner | Degianni Antonio | $115,000 |
Source: Public Records
Tax History Compared to Growth
Tax History
| Year | Tax Paid | Tax Assessment Tax Assessment Total Assessment is a certain percentage of the fair market value that is determined by local assessors to be the total taxable value of land and additions on the property. | Land | Improvement |
|---|---|---|---|---|
| 2025 | $10,475 | $54,743 | $13,565 | $41,178 |
| 2024 | $10,475 | $52,153 | $15,480 | $36,673 |
| 2023 | $10,475 | $52,153 | $13,521 | $38,632 |
| 2022 | $10,232 | $64,800 | $20,160 | $44,640 |
| 2021 | $10,176 | $64,260 | $20,160 | $44,100 |
| 2020 | $9,656 | $62,760 | $20,160 | $42,600 |
| 2019 | $9,092 | $60,540 | $20,160 | $40,380 |
| 2018 | $8,860 | $43,461 | $15,535 | $27,926 |
| 2017 | $8,707 | $42,712 | $17,044 | $25,668 |
| 2016 | $8,056 | $42,712 | $17,044 | $25,668 |
| 2015 | $4,640 | $38,016 | $21,715 | $16,301 |
| 2014 | $4,640 | $36,218 | $18,711 | $17,507 |
Source: Public Records
Map
Nearby Homes
- 101-14 95th St
- 101-46 95th St
- 100-08 101st Ave
- 97-56 101st St
- 97-47 94th St
- 10154 102nd St
- 10208 101st Ave
- 93-18 103rd Ave
- 10333 Woodhaven Blvd
- 103-47 96th St
- 10152 103rd St
- 103-48 96th St
- 97-25 102nd St
- 10109 97th Ave
- 95-11 95th St
- 10159 92nd St
- - 95th Ave
- 103-18 103rd St
- 103-50 102nd St
- 103-37 102nd St
- 10129 95th St
- 10121 95th St
- 10121 95th St
- 10131 95th St
- 10119 95th St Unit 2
- 10119 95th St Unit 1
- 101-19 95th St
- 10119 95th St
- 101-33 95th St
- 10119 95th St
- 10133 95th St
- 10133 95th St
- 10117 95th St
- 10124 97th St
- 101-17 95th St
- 10128 97th St
- 101-28 97th St Unit 2nd FL
- 101-28 97th St Unit 1
- 10141 95th St
- 10132 97th St