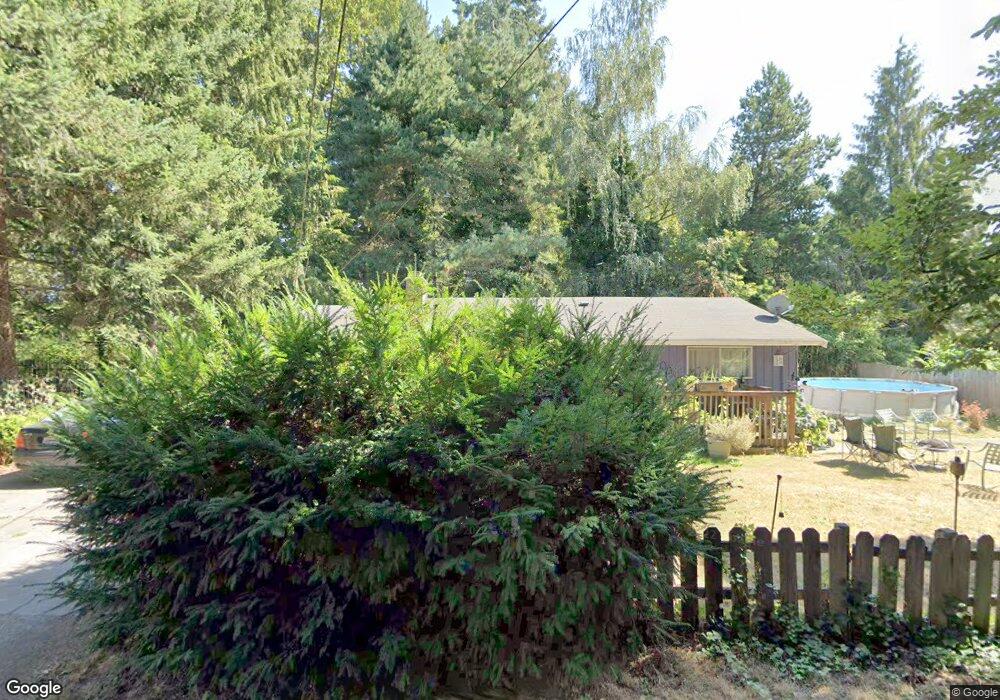
1013 4th St NE Puyallup, WA 98372
Estimated Value: $422,000 - $461,000
2
Beds
1
Bath
910
Sq Ft
$477/Sq Ft
Est. Value
About This Home
This home is located at 1013 4th St NE, Puyallup, WA 98372 and is currently estimated at $434,335, approximately $477 per square foot. 1013 4th St NE is a home located in Pierce County with nearby schools including Stewart Elementary School, Kalles Junior High School, and Puyallup High School.
Ownership History
Date
Name
Owned For
Owner Type
Purchase Details
Closed on
Jan 6, 2021
Sold by
Gordon Timothy M
Bought by
Gordon Timothy M and Gordon Autumn C
Current Estimated Value
Home Financials for this Owner
Home Financials are based on the most recent Mortgage that was taken out on this home.
Original Mortgage
$140,800
Outstanding Balance
$125,642
Interest Rate
2.7%
Mortgage Type
New Conventional
Estimated Equity
$308,693
Purchase Details
Closed on
Mar 1, 2012
Sold by
Deutsche Bank National Trust Company
Bought by
Gordon Timothy M
Home Financials for this Owner
Home Financials are based on the most recent Mortgage that was taken out on this home.
Original Mortgage
$100,685
Interest Rate
4.4%
Mortgage Type
FHA
Purchase Details
Closed on
Aug 10, 2011
Sold by
Leritz Justin
Bought by
Deutsche Bank National Trust Company
Purchase Details
Closed on
Nov 8, 2005
Sold by
Billesback Timothy L
Bought by
Leritz Justin
Home Financials for this Owner
Home Financials are based on the most recent Mortgage that was taken out on this home.
Original Mortgage
$155,600
Interest Rate
7.25%
Mortgage Type
Fannie Mae Freddie Mac
Create a Home Valuation Report for This Property
The Home Valuation Report is an in-depth analysis detailing your home's value as well as a comparison with similar homes in the area
Home Values in the Area
Average Home Value in this Area
Purchase History
| Date | Buyer | Sale Price | Title Company |
|---|---|---|---|
| Gordon Timothy M | -- | Stewart Title | |
| Gordon Timothy M | $70,000 | Fidelity National Title | |
| Deutsche Bank National Trust Company | $140,566 | None Available | |
| Leritz Justin | $194,500 | Fidelity National Title Insu |
Source: Public Records
Mortgage History
| Date | Status | Borrower | Loan Amount |
|---|---|---|---|
| Open | Gordon Timothy M | $140,800 | |
| Closed | Gordon Timothy M | $100,685 | |
| Previous Owner | Leritz Justin | $155,600 |
Source: Public Records
Tax History Compared to Growth
Tax History
| Year | Tax Paid | Tax Assessment Tax Assessment Total Assessment is a certain percentage of the fair market value that is determined by local assessors to be the total taxable value of land and additions on the property. | Land | Improvement |
|---|---|---|---|---|
| 2025 | $3,328 | $378,700 | $218,700 | $160,000 |
| 2024 | $3,328 | $360,800 | $193,000 | $167,800 |
| 2023 | $3,328 | $335,800 | $178,500 | $157,300 |
| 2022 | $3,338 | $355,000 | $194,200 | $160,800 |
| 2021 | $3,030 | $250,900 | $129,100 | $121,800 |
| 2019 | $2,649 | $233,100 | $117,000 | $116,100 |
| 2018 | $2,683 | $216,800 | $106,200 | $110,600 |
| 2017 | $2,452 | $194,600 | $88,000 | $106,600 |
| 2016 | $2,168 | $155,300 | $65,800 | $89,500 |
| 2014 | $1,911 | $143,100 | $58,000 | $85,100 |
| 2013 | $1,911 | $129,000 | $49,200 | $79,800 |
Source: Public Records
Map
Nearby Homes
- 422 8th Ave NE
- 10512 60th Street Ct E Unit 129
- 10722 62nd Street Ct E Unit 16
- 10609 62nd St E Unit 85
- 10805 62nd Street Ct E Unit 3
- 10923 63rd St E Unit B10923
- 10922 62nd St E Unit E10922
- 10924 63rd St E Unit N10924
- 10927 62nd St E Unit D10927
- 219 5th Ave NE
- 425 4th St NE
- 6305 111th Ave E Unit K6305
- 121 6th Ave NW
- 6307 111th Ave E Unit K6307
- 406 4th St NE
- 315 7th Ave NW
- 408 N Meridian
- 415 2nd St NW Unit A
- 10806 57th St E
- 501 7th Ave NW
- 409 10th St NE
- 409 10th Avenue Ct NE
- 409 10th Avenue Ct NE
- 405 10th Avenue Ct NE
- 405 10th Avenue Ct NE
- 413 10th Avenue Ct NE
- 17421 Ave Ct E Unit B
- 1004 4th St NE
- 417 10th Avenue Ct NE
- 421 10th Avenue Ct NE
- 916 4th St NE
- 410 10th Avenue Ct NE
- 421 10th Avenue Ct NE
- 416 10th Avenue Ct NE
- 905 4th St NE
- 1003 3rd St NE
- 912 4th St NE
- 12345 BZ Undisclosed
- 1005 3rd St NE
- 903 4th St NE